 Back
Consumer Behaviour and Utility Maximization: Microeconomics Study Notes
Study Guide - Smart Notes
 Tailored notes based on your materials, expanded with key definitions, examples, and context.
Consumer Behaviour
Marginal Utility and Consumer Choice
Consumer behaviour in microeconomics focuses on how individuals make choices to maximize their satisfaction, or utility, given their income and the prices of goods and services. Utility is a measure of satisfaction or happiness derived from consuming goods and services.
Utility: The satisfaction a consumer receives from consuming a good or service.
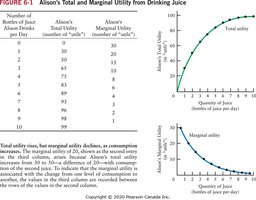
Total Utility: The total satisfaction from consuming a given quantity of a product.
Marginal Utility: The additional satisfaction from consuming one more unit of a product.
Diminishing Marginal Utility: As more units of a product are consumed, the marginal utility from each additional unit decreases.
Utility Schedules: Tables and graphs can illustrate how total and marginal utility change with consumption.
Example: Drinking water: The first litre provides high utility, but each additional litre provides less extra satisfaction.
Maximizing Utility
Consumers aim to allocate their income so that the last dollar spent on each product yields the same marginal utility. This is known as the utility-maximizing condition.
Utility-Maximizing Condition: For two products X and Y, the condition is: where and are the marginal utilities, and and are the prices of X and Y.
If the marginal utility per dollar spent is higher for one product, the consumer will buy more of that product and less of the other until equality is achieved.
Example: If Alison gets more utility per dollar from juice than from burritos, she will buy more juice and fewer burritos.
The Consumer’s Demand Curve
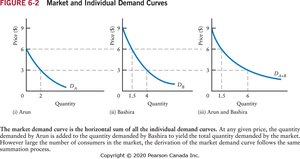
Changes in the price of a product affect the consumer’s utility-maximizing decision. If the price rises, the consumer reduces consumption, and vice versa. This leads to the negatively sloped demand curve.
Diminishing Marginal Utility: As quantity decreases, marginal utility increases, reinforcing the demand curve’s negative slope.
Demand Theory Prediction: A rise in price leads to a reduction in quantity demanded.
Income and Substitution Effects of Price Changes
Income and Substitution Effects
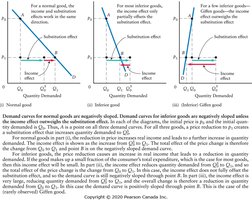
A change in price affects both the relative price of goods and the consumer’s real income. These effects are separated into the substitution effect and the income effect.
Real Income: The purchasing power of money income.
Substitution Effect: The change in quantity demanded due to a change in relative price, holding real income constant.
Income Effect: The change in quantity demanded due to a change in real income, holding relative prices constant.
Normal Goods: Both effects increase quantity demanded when price falls.
Inferior Goods: The income effect may reduce quantity demanded when price falls.
The Slope of the Demand Curve
The combined operation of the income and substitution effects ensures that the demand curve for normal goods is negatively sloped. However, exceptions exist, such as Giffen goods.
Giffen Goods: Inferior goods with a positively sloped demand curve, requiring a large income effect.
Conspicuous Consumption Goods: Goods consumed for their "snob appeal"; market demand is unlikely to be positively sloped due to offsetting behaviour by lower-income consumers.
Consumer Surplus
The Concept of Consumer Surplus
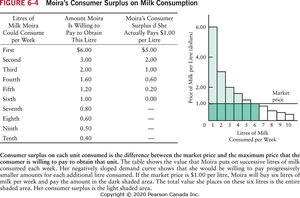
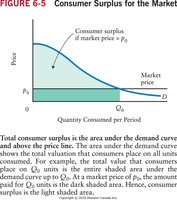
Consumer surplus is the difference between the total value consumers place on all units consumed and the payment they actually make. It is represented by the area under the demand curve and above the price line.
Consumer Surplus: The difference between the market price and the maximum price a consumer is willing to pay for each unit.
Total Consumer Surplus: The area under the demand curve and above the price line for all units consumed.
The Paradox of Value
Resolving the Paradox of Value
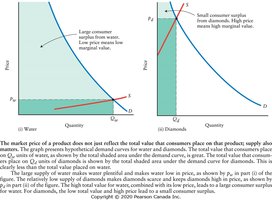
The paradox of value asks why essential goods like water have low prices, while non-essential goods like diamonds have high prices. The answer lies in both demand and supply, and the marginal value placed on the last unit consumed.
Marginal Value: The value placed on the last unit purchased, which equals the market price.
Supply: Plays a crucial role in determining price alongside demand.
Water: Plentiful supply, low price, high total value, low marginal value.
Diamonds: Scarce supply, high price, low total value, high marginal value.
Indifference Curves and Consumer Choice
Indifference Curves
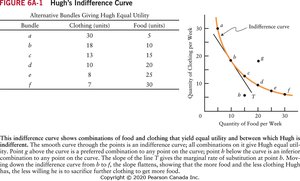
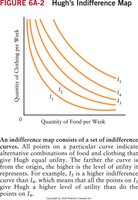
Indifference curves represent combinations of goods that yield the same utility to the consumer. The marginal rate of substitution (MRS) is the amount of one good a consumer is willing to give up to obtain another unit of another good and remain indifferent.
MRS: Negative and varies along the curve, reflecting diminishing marginal utility.
Shape: Indifference curves are convex to the origin.
Budget Line
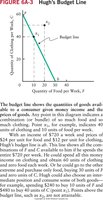
The budget line shows all combinations of goods that exhaust the consumer’s income. Points above the line are unattainable, while points below are affordable but do not use all income.
Utility-Maximizing Choice
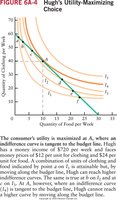
The consumer’s utility is maximized at the point where the budget line is tangent to an indifference curve. At this point, the MRS equals the ratio of the prices of the goods.
Utility-Maximizing Point:
Response to Changes in Income and Price
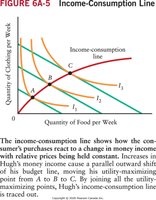
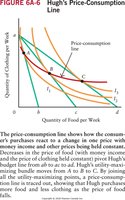
Changes in income or price shift the budget line and affect the consumer’s utility-maximizing choice. The income-consumption line traces the effect of income changes, while the price-consumption line traces the effect of price changes.
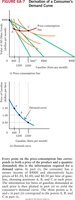
Derivation of Consumer Demand
The consumer’s demand curve can be derived from the price-consumption line, showing how quantity demanded changes as price changes.
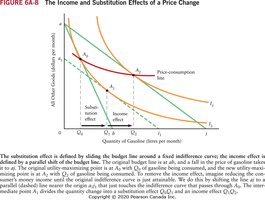
Income and Substitution Effects in Indifference Analysis
Indifference curve analysis separates the substitution and income effects of a price change. The substitution effect is shown by moving along the same indifference curve, while the income effect is shown by moving to a higher or lower indifference curve.
Behavioural Economics and Rationality
Rationality, Nudges, and Behavioural Economics
Behavioural economics questions the realism of traditional consumer theory, examining whether individuals are truly rational and how bounded rationality and the presentation of choices affect decision-making. These insights have implications for public policy.
Bounded Rationality: The idea that individuals are limited in their ability to make fully rational decisions.
Nudges: Small changes in the way choices are presented can influence consumer behaviour.
Policy Implications: Understanding behavioural biases can help design better policies to improve consumer welfare.
Additional info: Behavioural economics integrates psychology into economic models, recognizing that real-world decision-making often deviates from strict rationality.
