 Back
BackConsumer Behaviour: Utility, Demand, and Consumer Surplus
Study Guide - Smart Notes
 Tailored notes based on your materials, expanded with key definitions, examples, and context.
Consumer Behaviour
Introduction
This chapter explores the foundations of consumer behaviour in microeconomics, focusing on how individuals make choices to maximize their satisfaction (utility) given budget constraints. The analysis covers the concepts of utility, the derivation of demand curves, the effects of price changes, and the measurement of consumer surplus.
Marginal Utility and Consumer Choice
Utility: Total and Marginal
Utility is the satisfaction or pleasure a consumer derives from consuming goods and services. Although utility cannot be directly measured, economists use the concept of 'utils' to quantify it for analytical purposes.
Total Utility (TU): The total satisfaction received from consuming a certain quantity of a good.
Marginal Utility (MU): The additional satisfaction gained from consuming one more unit of a good.
Diminishing Marginal Utility: As a consumer consumes more units of a good, the marginal utility from each additional unit decreases, holding consumption of other goods constant.
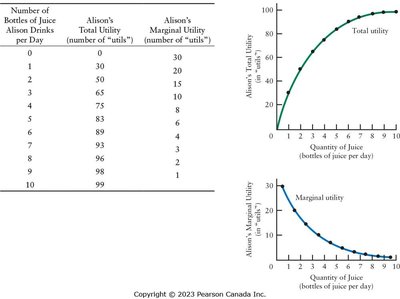
Example: Alison's total utility increases with each bottle of juice, but the marginal utility from each additional bottle declines, illustrating diminishing marginal utility.
Maximizing Utility
Consumers aim to maximize their total utility given their income and the prices of goods. The utility-maximizing condition is achieved when the marginal utility per dollar spent is equal across all goods:
For two goods, X and Y:
If this condition is not met, consumers can increase their total utility by reallocating their spending toward the good with higher marginal utility per dollar.
At equilibrium, no further reallocation can increase total utility.
Alternative Interpretation: The left side of the equation represents the consumer's ability to gain utility from the goods, while the right side represents the market-determined relative prices. Consumers adjust their consumption until these ratios are equal.
Is Utility Maximization Realistic?
While consumers may not consciously calculate marginal utilities and prices, the theory predicts behaviour consistent with observed demand curves.
Empirical evidence generally supports the predictions, though exceptions exist (e.g., due to framing effects or bounded rationality).
Rationality and Framing in Consumer Behaviour
Economists assume rational behaviour, but real-world choices can be influenced by how options are presented (framing effects).
Policy "nudges" can guide choices without restricting freedom, leveraging these behavioural tendencies.
The Consumer’s Demand Curve
Derivation from Utility Maximization
When the price of a good changes, the consumer adjusts their consumption to restore the utility-maximizing condition. Due to diminishing marginal utility, a price increase leads to reduced quantity demanded, resulting in a negatively sloped demand curve for each consumer.
Market Demand Curve
The market demand curve is the horizontal sum of all individual demand curves. At each price, the quantities demanded by all consumers are added together.
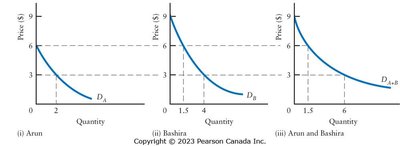
Example: The market demand curve for two consumers (Arun and Bashira) is obtained by summing their individual demand curves at each price.
Income and Substitution Effects of Price Changes
Understanding the Slope of the Demand Curve
A price change affects both the relative price of goods and the consumer's real income (purchasing power). These effects are separated into:
Substitution Effect (SE): The change in quantity demanded due to a change in the relative price, holding real income constant.
Income Effect (IE): The change in quantity demanded due to a change in real income, holding relative prices constant.
Substitution Effect
When the price of a good falls, it becomes relatively cheaper, so consumers substitute away from other goods toward the cheaper good.
To isolate the substitution effect, adjust income so the consumer can just afford their original consumption bundle at the new prices.
Income Effect
A price decrease increases real income, allowing the consumer to buy more overall.
For normal goods, the income effect increases quantity demanded; for inferior goods, it decreases quantity demanded.
Combined Effects and Demand Curve Slope
For normal goods, both effects increase quantity demanded when price falls, ensuring a downward-sloping demand curve.
For inferior goods, the income effect partially offsets the substitution effect, but demand usually still slopes downward.
For Giffen goods (rare), the income effect outweighs the substitution effect, potentially resulting in an upward-sloping demand curve.
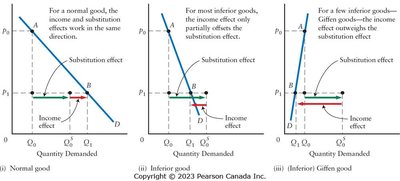
Example: The diagrams show how the substitution and income effects combine for normal, inferior, and Giffen goods when the price falls from p0 to p1.
Conspicuous Consumption Goods
Some goods are valued for their status (snob appeal), not just intrinsic qualities.
Price changes can affect the signaling value of such goods, but the market demand curve is still likely to be downward sloping due to the behaviour of the broader population.
Consumer Surplus
The Concept of Consumer Surplus
Consumer surplus is the difference between the total value consumers place on a quantity of a good and the amount they actually pay. It represents the net benefit to consumers from market transactions.
The area under the demand curve and above the market price line represents total consumer surplus.
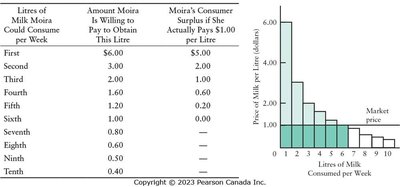
Example: Moira's consumer surplus is calculated as the sum of the differences between what she is willing to pay for each litre of milk and the market price she actually pays.
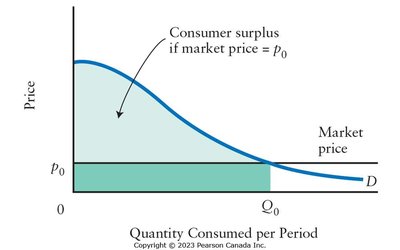
Market Consumer Surplus: For the entire market, consumer surplus is the area between the market demand curve and the price line, up to the quantity consumed.
The Paradox of Value
Explaining the Paradox
The paradox of value asks why essential goods like water have low prices, while non-essential goods like diamonds have high prices. The resolution lies in the distinction between total value and marginal value:
Supply and Demand: Both are crucial in determining price. Water is abundant (high supply), so its price and marginal value are low. Diamonds are scarce, so their price and marginal value are high.
Marginal Analysis: Consumers buy goods until the marginal value equals the market price. Thus, water's total value is high (large consumer surplus), but its marginal value and price are low. The opposite is true for diamonds.
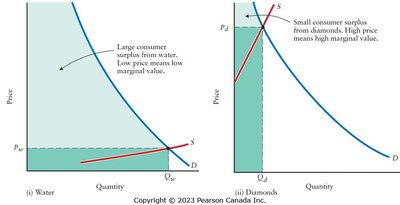
Example: The diagrams illustrate that water, despite its high total value, has a low price and large consumer surplus, while diamonds have a high price but low total value and small consumer surplus.
