 Back
BackConsumer Behaviour: Utility, Demand, and Consumer Surplus
Study Guide - Smart Notes
 Tailored notes based on your materials, expanded with key definitions, examples, and context.
Consumer Behaviour
Marginal Utility and Consumer Choice
Understanding consumer behaviour is fundamental to microeconomics, as it explains how individuals make decisions about purchasing goods and services. The concept of utility is central to this analysis.
Utility: The satisfaction or pleasure a consumer receives from consuming a good or service. Although utility cannot be directly measured, economists use the concept of 'utils' to quantify it for analytical purposes.
Total Utility: The overall satisfaction obtained from consuming a certain quantity of a product.
Marginal Utility: The additional satisfaction gained from consuming one more unit of a product.
Diminishing Marginal Utility: As a consumer consumes more units of a product, the marginal utility from each additional unit decreases, holding consumption of other products constant.
Example: Drinking water when thirsty provides high utility initially, but as more water is consumed, the additional satisfaction from each extra glass diminishes.
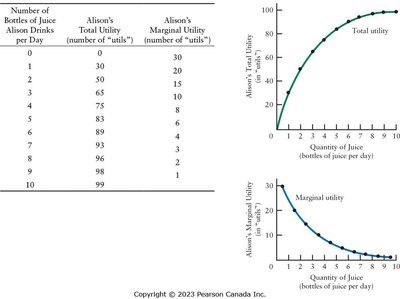
Additional info: The table and graphs illustrate how total utility increases with quantity, but marginal utility declines, exemplifying diminishing marginal utility.
Maximizing Utility
Consumers aim to maximize their total utility given their budget constraints. The utility-maximizing condition ensures that the last dollar spent on each product yields equal marginal utility.
Utility-Maximizing Condition: For two products X and Y, utility is maximized when:
Where MU_X and MU_Y are the marginal utilities of products X and Y, and p_X and p_Y are their prices.
If the marginal utility per dollar spent on one product exceeds that of another, the consumer will reallocate spending until equality is achieved.
Alternative Interpretation: The ratio of marginal utilities reflects the consumer's ability to adjust utility, while the price ratio is determined by the market.
Rationality and Framing: While the theory assumes rational behaviour, real-world decisions may be influenced by how choices are presented (framing), leading to policy interventions known as 'nudges'.
The Consumer's Demand Curve
The demand curve for an individual consumer is derived from the utility-maximizing behaviour. When the price of a product rises, the consumer reduces consumption to restore the utility-maximizing condition, resulting in a negatively sloped demand curve.
Market Demand Curve: The market demand curve is the horizontal sum of individual demand curves, reflecting total quantity demanded at each price.
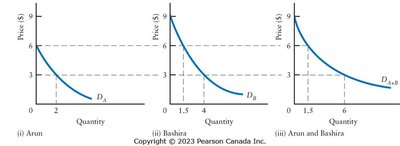
Additional info: The image shows how individual demand curves combine to form the market demand curve.
Income and Substitution Effects of Price Changes
A change in the price of a product affects consumer behaviour through two distinct effects: the substitution effect and the income effect.
Substitution Effect: The change in quantity demanded resulting from a change in the product's relative price, holding real income constant. Consumers substitute towards goods whose relative price has fallen.
Income Effect: The change in quantity demanded resulting from a change in real income, holding relative prices constant. For normal goods, a price decrease increases real income and quantity demanded; for inferior goods, the effect may be opposite.
Giffen Goods: Rare cases where the income effect outweighs the substitution effect, resulting in a positively sloped demand curve.
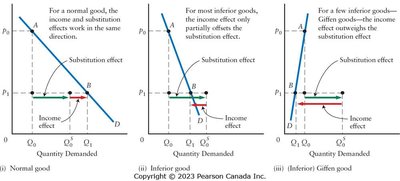
Additional info: The image illustrates the effects for normal, inferior, and Giffen goods, showing how the total effect is the sum of substitution and income effects.
Conspicuous Consumption Goods
Some goods are consumed for their status or 'snob appeal' rather than intrinsic qualities. The price of such goods can affect their signaling potential, but the theory of utility maximization still applies.
Example: Luxury cars or diamonds may confer status, and consumers may substitute away if the price falls and the status diminishes.
Market demand curves for such goods are unlikely to be positively sloped, as lower-income consumers may offset the behaviour of 'snobs'.
Consumer Surplus
Consumer surplus measures the 'bargain' consumers receive by paying less than the maximum price they are willing to pay for a product.
Definition: The difference between the total value consumers place on all units consumed and the payment actually made.
Calculation: The area under the demand curve and above the price line for a given quantity.
Example: If Moira is willing to pay $6 for the first litre of milk but only pays $1, her consumer surplus for that litre is $5.
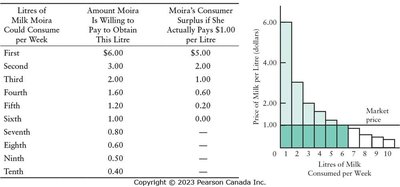
Additional info: The table and graph show how consumer surplus is calculated for each unit and summed for total surplus.
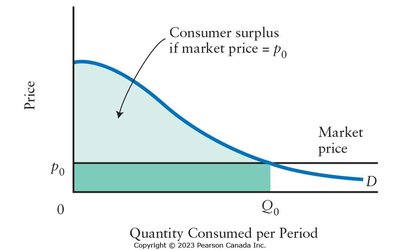
Additional info: The shaded area under the demand curve and above the price line represents total consumer surplus for the market.
The Paradox of Value
The paradox of value addresses why essential goods like water have low prices, while non-essential goods like diamonds have high prices.
Resolution: Price is determined by both supply and demand. Consumers purchase goods until the marginal value equals the market price.
Water is plentiful, so its price and marginal value are low, but total value is high. Diamonds are scarce, so their price and marginal value are high, but total value is low.
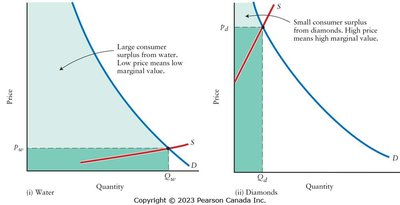
Additional info: The image compares consumer surplus for water and diamonds, illustrating the paradox and its resolution.
