 Back
BackChap 10 - Consumer Choice and Behavioral Economics: Utility, Indifference Curves, and Budget Constraints
Study Guide - Smart Notes
 Tailored notes based on your materials, expanded with key definitions, examples, and context.
Consumer Choice and Behavioral Economics
Utility and Consumer Decision Making
Utility is a central concept in microeconomics, referring to the satisfaction or enjoyment individuals receive from consuming goods and services. Although utility cannot be directly measured, economists use it to analyze consumer choices and preferences.
Utility: The satisfaction or pleasure derived from consuming a good or service.
Total Utility: The total amount of satisfaction obtained from consuming a certain quantity of a good.
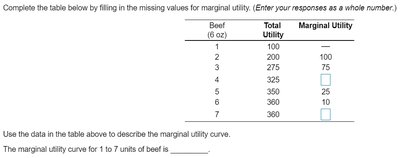
Marginal Utility (MU): The additional utility gained from consuming one more unit of a good or service.
As individuals consume more of a good, their total utility increases, but the additional satisfaction from each extra unit (marginal utility) typically decreases. This is known as the law of diminishing marginal utility.
Law of Diminishing Marginal Utility: As a consumer consumes more units of a good, the additional satisfaction from each subsequent unit decreases.
Example: Eating pizza at a party: The first slice provides high satisfaction, but by the fifth or sixth slice, the additional satisfaction is much lower, and may even become negative if you feel sick.
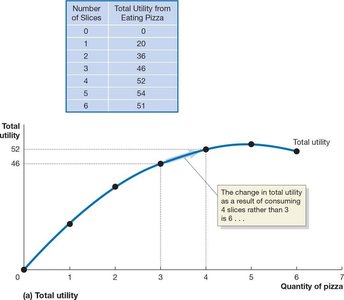
Additional info: Marginal utility can be calculated as the change in total utility divided by the change in quantity consumed.
Budget Constraints and Utility Maximization
Consumers face budget constraints, which limit the amount of goods and services they can purchase based on their income and the prices of goods. The goal is to allocate resources to maximize total utility within this constraint.
Budget Constraint: The limited amount of income available to spend on goods and services.
Marginal Utility per Dollar: The additional utility from spending one more dollar on a good, calculated as where is the marginal utility of good x and is its price.
To maximize utility, consumers should allocate their budget so that the marginal utility per dollar spent is equal across all goods:
Utility Maximization Rule:
Consumers should also exhaust their budget:
Example: If pizza costs .
Number of Slices of Pizza | Marginal Utility (MU) | Marginal Utility per Dollar (MU/P) | Cups of Coke | Marginal Utility (MU) | Marginal Utility per Dollar (MU/P) |
|---|---|---|---|---|---|
1 | 20 | 10 | 1 | 20 | 20 |
2 | 16 | 8 | 2 | 15 | 15 |
3 | 10 | 5 | 3 | 10 | 10 |
4 | 6 | 3 | 4 | 5 | 5 |
5 | 2 | 1 | 5 | 3 | 3 |
6 | -3 | -1.5 | 6 | -1 | -1 |
Additional info: The optimal consumption bundle is where the consumer's budget is exhausted and the marginal utility per dollar is equalized across goods.
Indifference Curves and Consumer Preferences
Indifference curves are used to analyze consumer preferences and choices between combinations of two goods. Each curve represents all combinations of goods that provide the same level of utility to the consumer.
Indifference Curve: A curve showing all combinations of two goods that give the consumer the same satisfaction.
Marginal Rate of Substitution (MRS): The rate at which a consumer is willing to trade one good for another while maintaining the same level of utility. Graphically, it is the slope of the indifference curve.
Indifference curves are typically convex to the origin, reflecting a diminishing MRS as more of one good is consumed.
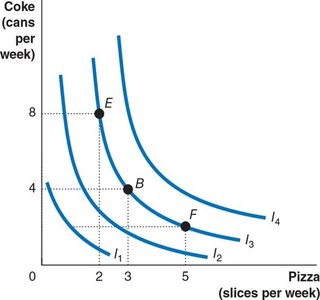
Example: If Dave is willing to give up 4 cans of Coke for 1 slice of pizza, his MRS is 4 at that point.
Properties of Indifference Curves
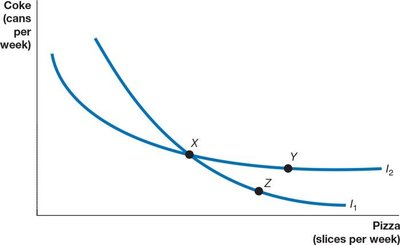
Indifference curves cannot cross.
Higher indifference curves represent higher levels of utility.
Lower indifference curves represent lower levels of utility.
Budget Constraints and Optimal Choice
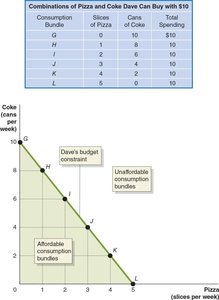
The consumer's budget constraint shows all combinations of two goods that can be purchased with a given income and prices. The optimal consumption bundle is found where the highest attainable indifference curve is tangent to the budget constraint.
Budget Line: Shows all combinations of two goods that can be purchased given income and prices.
The slope of the budget line is , where and are the prices of the two goods.
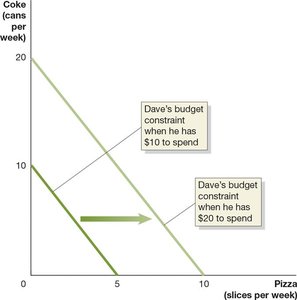
When income increases, the budget line shifts outward, allowing more consumption of both goods.
Finding the Optimal Consumption Bundle
The optimal bundle is where the indifference curve is tangent to the budget line.
At this point, the marginal rate of substitution equals the ratio of the prices of the two goods:
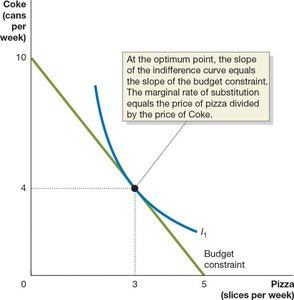
Additional info: At the optimal point, the consumer cannot increase utility by reallocating spending between goods, given the budget constraint.
Summary Table: Key Concepts in Consumer Choice
Concept | Definition | Formula |
|---|---|---|
Utility | Satisfaction from consumption | — |
Marginal Utility (MU) | Change in utility from one more unit | |
Budget Constraint | Income limit on spending | |
Utility Maximization | Equalize MU per dollar across goods | |
Indifference Curve | Combinations with equal utility | — |
Marginal Rate of Substitution (MRS) | Rate of trade-off between goods |
