 Back
BackConsumer Choice and Behavioral Economics: Utility, Demand, and Indifference Analysis
Study Guide - Smart Notes
 Tailored notes based on your materials, expanded with key definitions, examples, and context.
Consumer Choice and Behavioral Economics
Rationality and Consumer Decision-Making
Economists typically assume that consumers are rational, aiming to maximize their well-being given their limited resources. This rational behavior underpins the analysis of how consumers decide what and how much to purchase.
Scarcity: Consumers face budget constraints due to limited income.
Utility: The satisfaction or enjoyment derived from consuming goods and services.
Utility: Total and Marginal Utility
Utility is a central concept in consumer choice theory. It is not directly measurable but is useful for analyzing choices.
Total Utility (TU): The total satisfaction received from consuming a certain quantity of a good.
Marginal Utility (MU): The additional satisfaction from consuming one more unit of a good.
Law of Diminishing Marginal Utility: As more of a good is consumed, the additional satisfaction from each extra unit decreases.
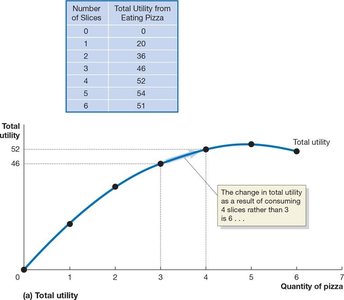
Example: The table and graph above show that as more slices of pizza are consumed, total utility increases at a decreasing rate, and eventually may decline.
Budget Constraints and Utility Maximization
Consumers must allocate their limited income among various goods to maximize utility. The budget constraint represents all combinations of goods a consumer can afford.
Marginal Utility per Dollar: , where is the marginal utility of good x and is its price.
Consumers maximize utility by equalizing the marginal utility per dollar across all goods:
Consumers should also exhaust their budget:
Spending on pizza + Spending on Coke = Budget
Adjustments to Price Changes: Income and Substitution Effects
When the price of a good changes, two effects occur:
Income Effect: A price decrease increases purchasing power, allowing more consumption (for normal goods).
Substitution Effect: The good becomes relatively cheaper, so consumers substitute towards it.
Deriving the Demand Curve
The individual demand curve shows the relationship between the price of a good and the quantity demanded, holding other factors constant. It is derived from the consumer's utility-maximizing choices at different prices.
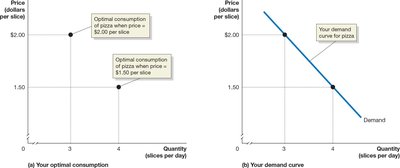
Example: As the price of pizza falls from $2.00 to $1.50, the optimal quantity consumed increases, tracing out the demand curve.
Market Demand Curve
The market demand curve is the horizontal sum of all individual demand curves for a good.
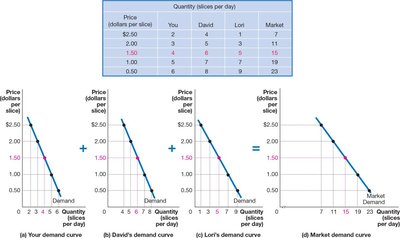
Example: By adding the quantities demanded by each consumer at each price, we obtain the market demand curve.
Social Influences and Behavioral Economics
Standard models assume independent decision-making, but real-world choices are influenced by social factors and behavioral biases.
Network Externalities: The value of a product increases as more people use it (e.g., social media platforms).
Fairness: People often value fairness, even at a financial cost (e.g., tipping, ticket pricing).
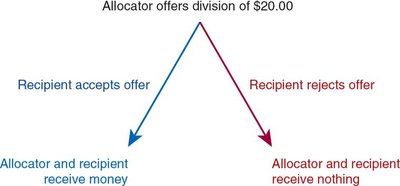
Experimental Economics: The Ultimatum Game
Laboratory experiments, such as the ultimatum game, reveal that people care about fairness and may reject offers they perceive as unfair, even at a cost to themselves.
Common Behavioral Mistakes
Behavioral economics identifies systematic deviations from rationality:
Ignoring Nonmonetary Costs: People often neglect opportunity costs that are not monetary.
Endowment Effect: People value items they own more than identical items they do not own.
Sunk Cost Fallacy: Allowing past, irrecoverable costs to affect current decisions.
Time Inconsistency: Preferences may change over time, leading to decisions that conflict with long-term goals.
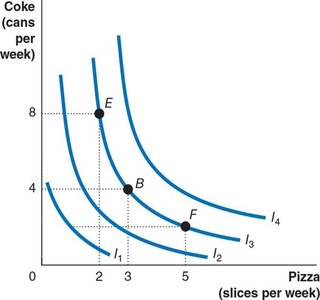
Indifference Curves and Budget Lines
Indifference curves represent combinations of goods that provide the same utility. The budget line shows all affordable combinations given income and prices.
Indifference Curve: Downward sloping and convex to the origin, higher curves represent higher utility.
Marginal Rate of Substitution (MRS): The rate at which a consumer is willing to trade one good for another, equal to the slope of the indifference curve.
Optimal Consumption Bundle
The optimal consumption bundle is found where the highest attainable indifference curve is tangent to the budget line.
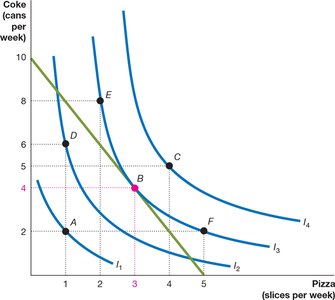
At this point, the slope of the indifference curve equals the slope of the budget line:
Or, in terms of marginal utility:
Effects of Changes in Income and Prices
Changes in income shift the budget line outward (more affordable combinations), while changes in prices rotate the budget line.
Normal Good: Quantity demanded increases as income rises.
Inferior Good: Quantity demanded decreases as income rises.
Summary Table: Effects of Price and Income Changes
Change | Budget Constraint | Effect on Consumption |
|---|---|---|
Increase in Income | Shifts outward | More of normal goods, less of inferior goods |
Decrease in Price of Good X | Rotates outward along X-axis | More of good X (income and substitution effects) |
Key Equations
Marginal Utility per Dollar:
Utility Maximization Rule:
Budget Constraint:
Marginal Rate of Substitution:
