 Back
BackConsumer Choice: Preferences, Utility, and Budget Constraints
Study Guide - Smart Notes
 Tailored notes based on your materials, expanded with key definitions, examples, and context.
Consumer Choice
Introduction to Consumer Choice
Consumer choice theory examines how individuals make decisions to allocate their limited resources among various goods and services to maximize their well-being. This chapter covers the foundational concepts of preferences, utility, budget constraints, and the process of constrained consumer choice, including insights from behavioral economics.
Preferences
Premises of Consumer Behavior
Individual preferences determine the satisfaction or pleasure derived from consuming goods and services.
Consumers face constraints (such as income and prices) that limit their choices.
Consumers aim to maximize their well-being (utility) within these constraints.
Properties of Consumer Preferences
Completeness: Consumers can compare and rank all possible bundles of goods. For any two bundles, a consumer either prefers one to the other or is indifferent between them.
Transitivity: Preferences are consistent. If a consumer prefers bundle A to B and B to C, then they also prefer A to C.
More Is Better (Nonsatiation): More of a good is preferred to less, holding all else constant. A good is something for which more is preferred; a bad is something for which less is preferred (e.g., pollution).
Preference Maps and Indifference Curves
Indifference Curve: A set of bundles among which the consumer is indifferent (each bundle provides the same level of satisfaction).
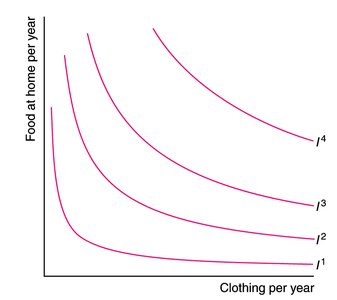
Indifference Map: A collection of indifference curves representing a consumer's entire preference structure.
Properties of Indifference Curves:
Curves farther from the origin represent higher utility (preferred bundles).
There is an indifference curve through every possible bundle.
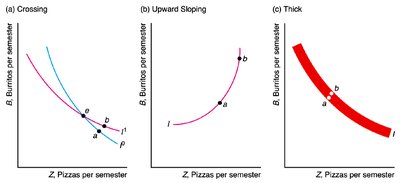
Indifference curves cannot cross.
Indifference curves slope downward (reflecting trade-offs between goods).
Impossible Indifference Curves
Curves that cross or are thick violate the basic properties of preferences (e.g., transitivity and 'more is better').
Marginal Rate of Substitution (MRS)
Willingness to Substitute Between Goods
The marginal rate of substitution (MRS) is the maximum amount of one good a consumer is willing to give up to obtain one more unit of another good, holding utility constant. It is the (absolute value of the) slope of the indifference curve.
Mathematically:
Typically, the MRS diminishes as the consumer substitutes one good for another (convex indifference curves).
Special Cases of Indifference Curves
Perfect Substitutes: Goods that a consumer is completely indifferent between (straight-line indifference curves, constant MRS).
Perfect Complements: Goods consumed in fixed proportions (L-shaped indifference curves).
Imperfect Substitutes: Most goods; indifference curves are convex to the origin.
Example: Bill views Coke and Pepsi as perfect substitutes; his indifference curves are straight lines with a slope of -1.
Example: Pie and ice cream as perfect complements; the consumer only values them in fixed ratios.
Application: Indifference Curves Between Food and Clothing
Indifference curves can be used to analyze trade-offs between any two goods, such as food and clothing.
Utility
Utility and Utility Functions
Utility: A numerical measure of satisfaction or pleasure derived from consuming goods and services.
Utility Function: Assigns a utility value to every possible bundle of goods, e.g., .
Ordinal Utility: Only the ranking of bundles matters, not the magnitude of differences.
Cardinal Utility: The magnitude of differences in utility is meaningful (rarely assumed in microeconomics).
Utility and Indifference Curves
Each indifference curve corresponds to a particular utility level.
All bundles on the same indifference curve yield the same utility.


Marginal Utility
Marginal Utility (MU): The additional utility gained from consuming one more unit of a good, holding other goods constant.
For good Z:
Marginal utility typically decreases as more of a good is consumed (diminishing marginal utility).

Relationship Between Marginal Utility and MRS
The MRS between two goods equals the negative ratio of their marginal utilities:
Budget Constraint
Budget Line and Opportunity Set
Budget Line: Shows all combinations of goods that exhaust a consumer's income at given prices.
Equation:
Opportunity Set: All affordable bundles (on or below the budget line).
Solving the Budget Constraint
To find the maximum amount of one good (e.g., burritos) that can be bought, solve for B:
Example Calculation
If , , :
Allocations Table
Table 4.1 (not shown) would list possible combinations of burritos and pizzas that exhaust the $50 budget.
Graphical Representation

Slope of the Budget Constraint
The slope of the budget line is , also called the marginal rate of transformation (MRT).
MRT represents the rate at which the market allows the consumer to trade one good for another.
Changes in the Budget Constraint
If the price of a good increases, the budget line pivots inward (steeper slope).
If income increases, the budget line shifts outward (parallel shift, same slope).


Rationing and Opportunity Set
Government-imposed quotas (e.g., water rationing) restrict the opportunity set, even if the consumer could afford more.
Constrained Consumer Choice
Optimal Choice
The consumer's optimal bundle is the most preferred bundle that is affordable (on the highest attainable indifference curve tangent to the budget line).
At the optimum, the slope of the indifference curve equals the slope of the budget line:
or

Corner Solutions
Occur when the consumer spends all income on one good (e.g., due to preferences or prices).
Comparative Example
Different consumers may choose different optimal bundles due to differences in prices or constraints, even with identical preferences (e.g., Nigel and Bob choosing between SUVs and sedans).
Applications and Policy
Food Stamps (SNAP) vs. Cash Subsidy
Food stamps restrict spending to food, altering the budget constraint compared to a cash subsidy.
Switching to cash may increase recipients' well-being by allowing more flexible consumption choices.
Behavioral Economics
Insights from Psychology
Behavioral economics incorporates psychological findings into economic models to better predict real-world decision-making.
Key phenomena include:
Transitivity: Adults generally make transitive choices; children may not.
Endowment Effect: People value goods more when they own them, contrary to standard theory.
Salience: Consumers are more likely to consider information that is prominent or easy to process (e.g., ignoring taxes not included in posted prices).
Bounded Rationality: People have limited cognitive resources for solving complex problems or considering all options.
