 Back
Consumer Theory: Preferences, Budget Constraints, and Optimal Choice
Study Guide - Smart Notes
 Tailored notes based on your materials, expanded with key definitions, examples, and context.
Consumer Theory
Rational Consumer Theory
Consumer theory in microeconomics examines how individuals make choices about what goods and services to purchase, given their preferences and budget constraints. The theory assumes that consumers are rational, meaning their choices are intentional and consistent, and are limited by their available resources.
Intentional Choices: Consumers make deliberate decisions based on their preferences.
Budget Constraints: Choices are limited by the amount of money available to spend.
Revealed Preferences: According to Samuelson (1938), preferences are revealed through choices, and rationality is defined as consistency in these preferences.
Consumption Possibilities and Budget Constraints
Consumers face a set of possible combinations of goods they can afford, known as the budget set. The budget line represents the maximum combinations of two goods that a consumer can purchase given their income and the prices of the goods.
Budget Equation:
Budget Line:
Example: If milk costs .
Budget Line and Slope
The slope of the budget line reflects the relative price of the two goods. It shows how much of one good must be given up to obtain more of the other.
Slope of Budget Line:
Interpretation: The slope indicates the opportunity cost of consuming one more unit of a good.
Changes in Income and Prices
Changes in income shift the budget line parallel, while changes in the price of a good rotate the budget line.
Income Increase: Parallel shift outward, more combinations affordable.
Price Change: Rotation of the budget line, changing the slope.
Preference Maps and Indifference Curves
Preferences are represented by indifference curves, which show combinations of goods that provide the same level of satisfaction to the consumer. Higher indifference curves represent higher levels of utility.
Indifference Curve: A curve showing combinations of goods equally preferred by the consumer.
Free Disposal: More is better, ceteris paribus.
Indifference Curve Map: A collection of indifference curves representing different utility levels.

Marginal Rate of Substitution (MRS)
The marginal rate of substitution (MRS) measures the rate at which a consumer is willing to substitute one good for another while maintaining the same level of satisfaction. It is related to the slope of the indifference curve.
Definition: MRS is the rate at which a consumer will give up one good for another while remaining indifferent.
Formula:
Diminishing MRS: Indifference curves typically get flatter, indicating a preference for variety and decreasing marginal benefits.
Types of Substitutability
Goods can be classified based on how easily they can be substituted for one another.
Perfect Substitutes: Goods that can be exchanged at a constant rate.
Perfect Complements: Goods that are consumed together in fixed proportions.
Ordinary Goods: Most goods, with diminishing marginal rate of substitution.
Optimal Choice and Consumer Demand
The optimal consumption bundle is the combination of goods that maximizes a consumer's utility given their budget constraint. This occurs where the highest indifference curve is tangent to the budget line.
Optimality Condition: At the optimal point,
Movement Along Demand: Changes in price lead to movement along the demand curve.
Income Changes: Lead to shifts in demand for normal goods.
Examples and Applications
Example: Anna's optimal choice is 10 litres of milk and 5 portions of salad, given her budget and preferences.
Application: Understanding consumer theory helps explain market demand and how consumers respond to changes in prices and income.
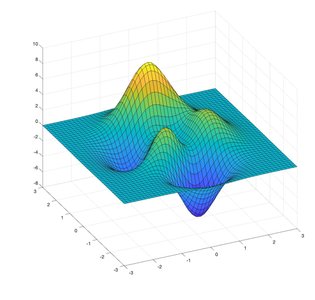
Additional info: The contour map (image_1) is used as an analogy for indifference curves, showing levels of utility as 'elevation.' The 3D surface plot (image_2) visually represents a utility function, with indifference curves as slices at different utility levels.
