 Back
Demand Elasticities and Their Determinants
Study Guide - Smart Notes
 Tailored notes based on your materials, expanded with key definitions, examples, and context.
Buyer’s Problem: Demand Elasticities
Introduction to Demand Elasticities
Demand elasticity measures how sensitive the quantity demanded of a good is to changes in various economic factors, such as price, income, or the price of related goods. Understanding elasticity is crucial for predicting consumer behavior and optimizing pricing strategies.
Price Elasticity of Demand (Ed): Measures the responsiveness of quantity demanded to changes in the price of the good itself.
Cross-Price Elasticity of Demand (Exy): Measures how the quantity demanded of one good changes in response to a change in the price of another good.
Income Elasticity of Demand (Ei): Measures how the quantity demanded changes as consumer income changes.
Price Elasticity of Demand (Ed)
Definition and Calculation
The price elasticity of demand quantifies the percentage change in quantity demanded resulting from a percentage change in price. It is calculated using the midpoint formula:
Formula:
Interpretation: If Ed > 1, demand is elastic; if Ed < 1, demand is inelastic; if Ed = 1, demand is unit elastic.
The Relation Between Ed and Revenue
Price elasticity is important because it helps determine optimal pricing strategies. When demand is elastic, lowering price increases total revenue; when demand is inelastic, raising price increases total revenue.
Total Revenue:
Example: If price increases from $5 to $6, revenue may increase or decrease depending on elasticity.
Determinants of Price Elasticity of Demand
Several factors influence the price elasticity of demand:
Closeness and Number of Substitutes: Goods with many substitutes tend to have higher elasticity.
Available Time to Adjust: Elasticity increases over time as consumers find alternatives.
Budget Share Spent on the Good: Goods that take up a larger share of the budget are more elastic.
Closeness and Number of Substitutes
If a good has many alternatives, consumers are more likely to switch when the price changes, resulting in higher elasticity. If there are few or no substitutes, elasticity is lower.
Example: Olive oil in Turkey vs. the US; more alternatives in the US lead to higher elasticity.
Available Time to Adjust
Consumers may not immediately adjust their consumption when prices change, but over time, they find alternatives, increasing elasticity.
Example: A professor's demand for olive oil becomes more elastic after spending more time in the US and learning about alternatives.
Budget Share Spent on the Good
Goods that represent a larger portion of a consumer's budget tend to have higher elasticity. For example, luxury items like iPhones are more elastic than necessities like salt.
Example: A 10% price increase in gas affects consumers more when the initial price is higher.
Cross-Price Elasticity of Demand (Exy)
Definition and Calculation
The cross-price elasticity of demand measures how the quantity demanded of one good changes in response to a change in the price of another good.
Formula:
Interpretation: Positive Exy indicates substitutes; negative Exy indicates complements.
Example Calculation
Example: If the price of Good Y increases by 20% and the quantity of Good X demanded falls from 12 to 8:
Percentage change in quantity:
Exy:
Income Elasticity of Demand (Ei)
Definition and Calculation
The income elasticity of demand measures the percentage change in quantity demanded resulting from a percentage change in income.
Formula:
Interpretation: Positive Ei indicates normal goods; negative Ei indicates inferior goods.
Example Calculation
Example: If income increases from $40,000 to $60,000 and quantity demanded rises from 800 to 1,200:
Percentage change in quantity:
Percentage change in income:
Ei:
Application: Demand Schedule and Elasticity Calculation
Demand Schedule for Bags
The following table shows the relationship between price and quantity demanded for bags. This data can be used to calculate price elasticity of demand using the midpoint formula.
Price | Quantity |
|---|---|
$13 | 60 |
$15 | 56 |
$17 | 48 |
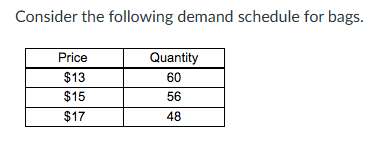
Example Calculation: To find the price elasticity between $13 and $15:
Percentage change in quantity:
Percentage change in price:
Ed:
Interpretation and Applications
Revenue Implications
Understanding elasticity helps firms decide whether to raise or lower prices to maximize revenue. For example, if demand is inelastic, increasing price increases revenue; if demand is elastic, decreasing price increases revenue.
Classification of Goods
Normal Goods: Positive income elasticity.
Inferior Goods: Negative income elasticity.
Luxury Goods: Income elasticity greater than one.
Necessities: Income elasticity less than one but positive.
Summary Table: Types of Elasticity
Elasticity Type | Formula | Interpretation |
|---|---|---|
Price Elasticity of Demand (Ed) | Ed > 1: Elastic; Ed < 1: Inelastic; Ed = 1: Unit elastic | |
Cross-Price Elasticity (Exy) | Exy > 0: Substitutes; Exy < 0: Complements | |
Income Elasticity (Ei) | Ei > 0: Normal goods; Ei < 0: Inferior goods |
Additional info: Academic context and examples were added to clarify elasticity concepts and their determinants, as well as to provide self-contained explanations suitable for exam preparation.
