 Back
BackDemand, Supply, and Equilibrium: Microeconomics Study Guide
Study Guide - Smart Notes
 Tailored notes based on your materials, expanded with key definitions, examples, and context.
Demand, Supply, and Equilibrium
Key Concepts and Market Structure
This section introduces the foundational concepts of microeconomics, focusing on how markets operate, the behavior of buyers and sellers, and the determination of equilibrium price and quantity. In a perfectly competitive market, sellers offer identical goods, and no individual buyer or seller can influence the market price. All participants are price-takers, and the market price is determined by the interaction of supply and demand.
Perfectly Competitive Market: Sellers offer identical goods; buyers and sellers are price-takers.
Market Price: The price at which transactions occur between buyers and sellers.
Market: A group of economic agents trading goods/services under specific rules.


How Do Buyers Behave?
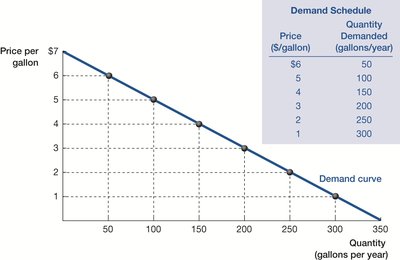
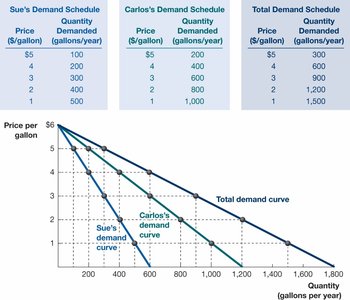
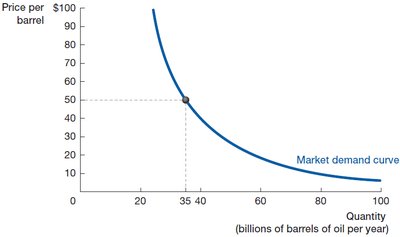
Buyers' behavior is influenced by price and other factors. The demand schedule shows the quantity demanded at various prices, while the demand curve plots this relationship graphically. The concept of ceteris paribus (holding all else equal) is crucial for isolating the effect of price changes. Buyers' willingness to pay varies, leading to different demand curves for individuals and the market as a whole.
Demand Schedule: Table showing quantity demanded at different prices.
Quantity Demanded: Amount buyers are willing to purchase at a given price.
Demand Curve: Graph plotting quantity demanded against price.
Law of Demand: Quantity demanded rises as price falls, ceteris paribus.
Market Demand Curve: Sum of individual demand curves.
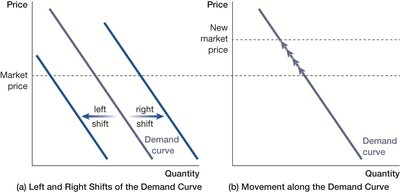
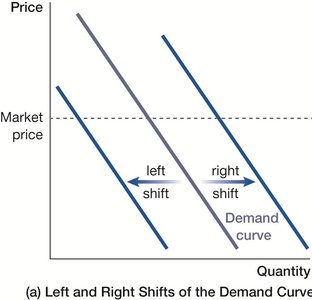
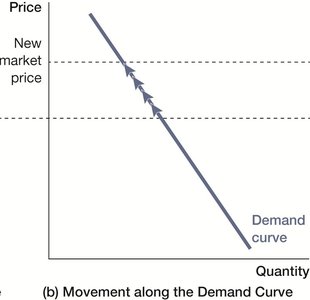
Shifts vs. Movements Along the Demand Curve
A movement along the demand curve is caused by a change in the good's own price. Shifts of the demand curve occur when other factors change, such as tastes, income, prices of related goods, number of buyers, or expectations about the future.
Movement Along Curve: Caused by price change.
Shift of Curve: Caused by changes in tastes, income, related goods, number of buyers, or expectations.
Normal Goods vs. Inferior Goods
Goods are classified based on how demand responds to changes in income:
Normal Good: Demand increases as income rises.
Inferior Good: Demand decreases as income rises.


Substitutes and Complements
Substitutes: A rise in the price of one leads to increased demand for the other (e.g., public transportation and gasoline).
Complements: A fall in the price of one leads to increased demand for the other.
Summary Table: Demand Shifters
Shifter | Effect on Demand Curve |
|---|---|
Tastes and Preferences | Right or left shift |
Income and Wealth | Right (normal) or left (inferior) shift |
Prices of Related Goods | Right (substitute) or right (complement) |
Number and Scale of Buyers | Right or left shift |
Expectations about the Future | Right or left shift |
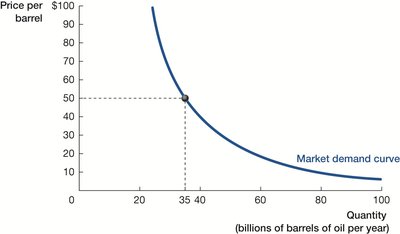
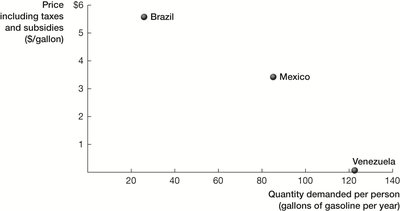
Evidence-Based Economics: Gasoline Demand
Empirical data shows how gasoline demand varies with price across countries, illustrating the law of demand.
How Do Sellers Behave?
Sellers' behavior is described by the supply schedule and supply curve. The law of supply states that quantity supplied increases as price rises, ceteris paribus. Sellers' willingness to accept is the minimum price they are willing to receive for an extra unit.
Supply Schedule: Table showing quantity supplied at different prices.
Supply Curve: Graph plotting quantity supplied against price.
Law of Supply: Quantity supplied rises as price rises, ceteris paribus.
Market Supply Curve: Sum of individual supply curves.
Shifts vs. Movements Along the Supply Curve
Movement Along Curve: Caused by price change.
Shift of Curve: Caused by changes in input prices, technology, number of sellers, or expectations.
Summary Table: Supply Shifters
Shifter | Effect on Supply Curve |
|---|---|
Input Prices | Left or right shift |
Technology | Right shift |
Number and Scale of Sellers | Right or left shift |
Expectations about the Future | Right or left shift |
Supply and Demand in Equilibrium
The competitive equilibrium is the point where quantity demanded equals quantity supplied. At this price, the market clears, and there is no excess demand (shortage) or excess supply (surplus).
Excess Demand: Quantity demanded exceeds quantity supplied (shortage).
Excess Supply: Quantity supplied exceeds quantity demanded (surplus).
Competitive Equilibrium Price: The price at which the market clears.
Curve Shifting in Competitive Equilibrium
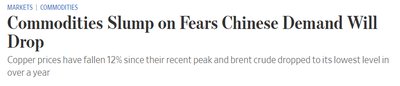
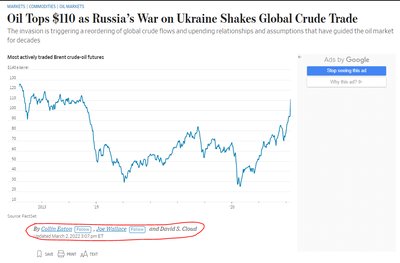
Changes in supply or demand shift the equilibrium price and quantity. For example, a leftward shift in supply (e.g., due to OPEC cuts) raises price and lowers quantity, while a rightward shift in supply (e.g., technological breakthrough) lowers price and increases quantity. Simultaneous shifts can have complex effects.
Price Controls and Market Outcomes
Government intervention, such as price controls, can prevent markets from reaching equilibrium. Examples include gasoline price caps during the U.S. oil crisis and rent control laws in Argentina. Price controls often lead to shortages, reduced supply, and loss of economic surplus.
Price Control: Government-imposed limit on prices.
Rent Control: Example of price control in housing markets.
Economic Surplus: Total benefit to society from market transactions.
Example Table: Effects of Rent Control
Scenario | Equilibrium Rent | Equilibrium Quantity | Total Economic Surplus |
|---|---|---|---|
Unregulated Market | $600/apt | 3000 apts/mo | $1,800,000/mo |
Rent Control | $200/apt | 1000 apts/mo | $800,000/mo |
Summary Table: Effects of Shifts in Supply and Demand
Change in Supply | Change in Demand | Equilibrium Price | Equilibrium Quantity |
|---|---|---|---|
Increase | Increase | ? | Increase |
Increase | Decrease | Decrease | ? |
Decrease | Increase | Increase | ? |
Decrease | Decrease | ? | Decrease |
Key Formulas
Demand Function:
Supply Function:
Equilibrium:
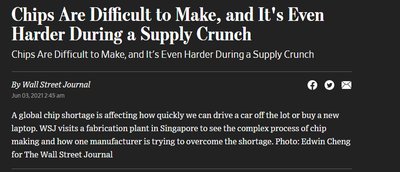
Applications and Examples
Real-world examples such as the microchip shortage, oil market fluctuations, and stock market events (e.g., GameStop) illustrate the impact of supply and demand shifts, market equilibrium, and government intervention.

Additional info: This study guide expands on the original notes by providing definitions, examples, tables, and formulas to ensure completeness and academic quality. Images are included only when directly relevant to the explanation.
