 Back
Demand, Supply, and Market Equilibrium: Core Concepts in Microeconomics
Study Guide - Smart Notes
 Tailored notes based on your materials, expanded with key definitions, examples, and context.
Markets and Economic Agents
Definitions and the Circular Flow Model
Markets are the primary institutions through which goods and services are exchanged in modern economies. The main economic agents are firms (producers), households (consumers), and entrepreneurs (organizers and risk-takers). The circular flow diagram illustrates the continuous movement of resources, goods, services, and money between households and firms through input and output markets.
Firms: Transform inputs (resources) into outputs (goods and services).
Households: Supply inputs (labor, capital, land) and demand goods and services.
Input (factor) markets: Where households supply and firms demand resources.
Output (product) markets: Where firms supply and households demand goods and services.
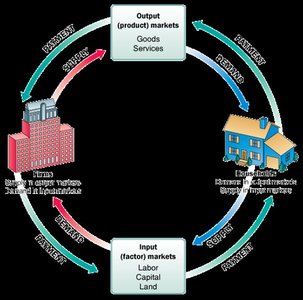
Additional info: The circular flow model demonstrates the interdependence of households and firms, with money flowing in the opposite direction to goods and services.
Demand in Product/Output Markets
Quantity Demanded and the Law of Demand
The quantity demanded is the amount of a good households are willing to buy at a given price, holding all else constant (ceteris paribus). The law of demand states that, ceteris paribus, as the price of a good rises, the quantity demanded falls, and vice versa.
Demand schedule: Table showing quantity demanded at various prices.
Demand curve: Graphical representation of the demand schedule, typically downward sloping.
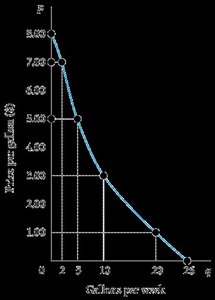
Properties of demand curves:
Negative slope (inverse relationship between price and quantity demanded).
Intersect the quantity axis (due to time and diminishing marginal utility).
Intersect the price axis (due to limited income and wealth).
Shifts in the Demand Curve
Factors other than price can shift the demand curve:
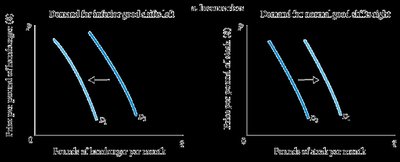
Income and wealth: Higher income increases demand for normal goods and decreases demand for inferior goods.
Prices of related goods: Substitutes and complements affect demand.
Tastes and preferences: Changes can shift demand left or right.
Expectations: Anticipated future prices or availability affect current demand.
Substitutes and Complements
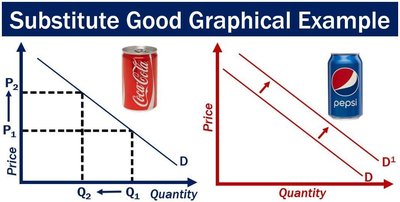
Substitute goods are goods that can replace each other. An increase in the price of one increases demand for the other. Complementary goods are consumed together; an increase in the price of one decreases demand for the other.
Substitutes: Coca-Cola and Pepsi, Starbucks coffee and homemade coffee.
Complements: Coffee and cream, pancakes and syrup.


Movements vs. Shifts
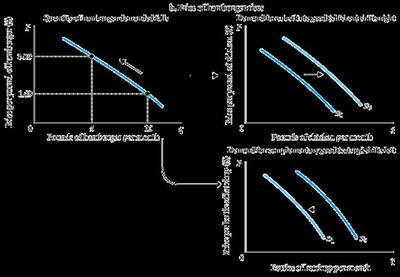
A movement along the demand curve is caused by a change in the good's own price. A shift of the demand curve is caused by changes in other determinants (income, prices of related goods, tastes, expectations).
Market Demand
Market demand is the sum of all individual household demands for a good at each price. The market demand curve is derived by horizontally summing individual demand curves.
Supply in Product/Output Markets
Quantity Supplied and the Law of Supply
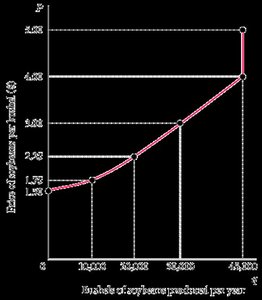
The quantity supplied is the amount of a good firms are willing to sell at a given price. The law of supply states that, ceteris paribus, as the price of a good rises, the quantity supplied rises, and vice versa.
Supply schedule: Table showing quantity supplied at various prices.
Supply curve: Graphical representation of the supply schedule, typically upward sloping.
Shifts in the Supply Curve
Factors that shift the supply curve include:
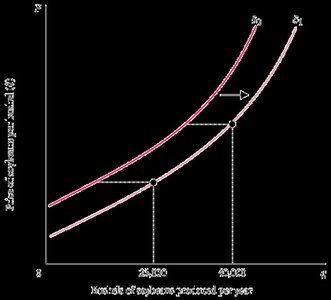
Input prices: Higher input prices decrease supply (shift left); lower input prices increase supply (shift right).
Technology: Improvements increase supply (shift right).
Prices of related products: If a firm can produce multiple goods, a higher price for one may decrease supply of the other.
Movements vs. Shifts in Supply
A movement along the supply curve is caused by a change in the good's own price. A shift of the supply curve is caused by changes in input prices, technology, or prices of related goods.
Market Supply
Market supply is the sum of all individual firms' supply at each price. The market supply curve is derived by horizontally summing individual supply curves.
Market Equilibrium
Equilibrium, Excess Demand, and Excess Supply
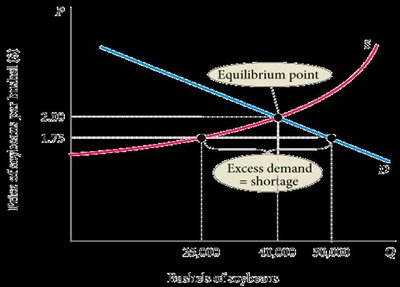
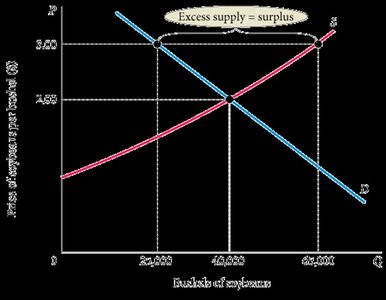
Market equilibrium occurs where quantity demanded equals quantity supplied at the current price. At this point, there is no tendency for price to change.
Excess demand (shortage): Quantity demanded exceeds quantity supplied at the current price; price tends to rise.
Excess supply (surplus): Quantity supplied exceeds quantity demanded at the current price; price tends to fall.
Changes in Equilibrium
Shifts in demand or supply curves lead to new equilibrium prices and quantities. It is essential to identify which curve is shifting and the direction of the shift to predict market outcomes.
Increase in demand: Equilibrium price and quantity rise.
Decrease in demand: Equilibrium price and quantity fall.
Increase in supply: Equilibrium price falls, quantity rises.
Decrease in supply: Equilibrium price rises, quantity falls.
Summary Table: Factors Affecting Demand and Supply
Factor | Effect on Demand | Effect on Supply |
|---|---|---|
Price of the good | Movement along demand curve | Movement along supply curve |
Income (normal good) | Increase shifts demand right | No direct effect |
Income (inferior good) | Increase shifts demand left | No direct effect |
Price of substitute | Increase shifts demand right | No direct effect |
Price of complement | Increase shifts demand left | No direct effect |
Input prices | No direct effect | Increase shifts supply left |
Technology | No direct effect | Improvement shifts supply right |
Expectations | Can shift demand left or right | Can shift supply left or right |
Tastes/Preferences | Can shift demand left or right | No direct effect |
Key Equations
Market Demand:
Market Supply:
Equilibrium Condition:
Additional info: These equations summarize the aggregation of individual demands and supplies, and the equilibrium condition in a competitive market.
