 Back
Back3. Demand, Supply, and Market Equilibrium: Foundations of Microeconomics
Study Guide - Smart Notes
 Tailored notes based on your materials, expanded with key definitions, examples, and context.
Demand and Supply in Competitive Markets
Introduction to Demand and Supply
Understanding how markets work is central to microeconomics. The interaction of demand and supply determines prices and quantities of goods and services in competitive markets. This section introduces the foundational concepts of demand, supply, and market equilibrium.
Demand
Law of Demand
The law of demand states that, other things remaining the same, the higher the price of a good, the lower the quantity demanded. This relationship is typically represented by a downward-sloping demand curve, with price on the vertical axis and quantity on the horizontal axis.
Quantity demanded: The amount of a good buyers are willing and able to purchase at a given price.
Demand schedule: A table showing the relationship between price and quantity demanded.
Market demand: The horizontal summation of all individual demands at each price level.
Example: If the price of movie tickets decreases, more people are willing to buy tickets, increasing the quantity demanded.
Consumer Theory and Marginal Benefit
Consumers make purchase decisions by comparing the marginal benefit (MB) of an additional unit to its price. The willingness to pay (WTP) for each unit reflects the marginal benefit. The demand curve can be interpreted as the WTP curve.
Optimal purchase rule: Buy additional units as long as MB >= Price.
Diminishing marginal benefit: Each additional unit provides less extra benefit, leading to a downward-sloping demand curve.
Market Demand
Market demand is found by horizontally adding individual demand curves. At each price, sum the quantities demanded by all consumers to obtain the total market demand.
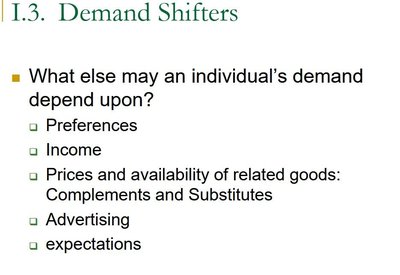
Demand Shifters
Factors other than price can shift the entire demand curve. These are known as demand shifters:
Preferences
Income (normal vs. inferior goods)
Prices of related goods (substitutes and complements)
Advertising
Expectations about future prices or income
Normal and Inferior Goods
Normal goods: Demand increases as income rises.
Inferior goods: Demand decreases as income rises.
Substitutes and Complements
Substitutes: Goods that can replace each other. An increase in the price of one increases demand for the other (e.g., Coke and Pepsi).
Complements: Goods used together. An increase in the price of one decreases demand for the other (e.g., printers and ink cartridges).
Movement vs. Shift
Movement along the demand curve: Caused by a change in the good's own price.
Shift of the demand curve: Caused by changes in other factors (income, preferences, prices of related goods, etc.).
Supply
Law of Supply
The law of supply states that, other things remaining the same, the higher the price of a good, the greater the quantity supplied. The supply curve is upward-sloping.
Quantity supplied: The amount of a good sellers are willing and able to sell at a given price.
Supply schedule: A table showing the relationship between price and quantity supplied.
Market supply: The horizontal summation of all individual supply curves.
Producer Theory and Marginal Cost
Firms maximize profit by choosing the quantity where price equals marginal cost (MC). The supply curve can be interpreted as the marginal cost curve in a competitive market.
Profit maximization rule: Produce up to the point where P = MC.
Short-run supply: Plant size and technology are fixed; only variable inputs can change.
Supply Shifters
Factors other than price can shift the entire supply curve. These are known as supply shifters:
Prices of productive resources (inputs)
Prices of related goods produced
Expected future prices
Technology
Number of suppliers
Movement vs. Shift
Movement along the supply curve: Caused by a change in the good's own price.
Shift of the supply curve: Caused by changes in other factors (input prices, technology, etc.).
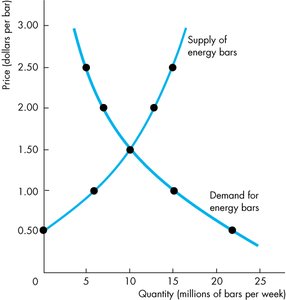
Market Equilibrium
Determination of Equilibrium
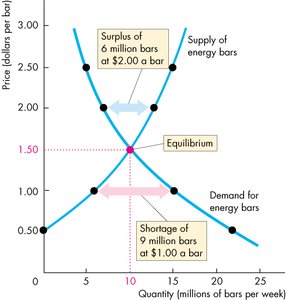
Market equilibrium occurs where the quantity demanded equals the quantity supplied. The corresponding price is the equilibrium price, and the quantity is the equilibrium quantity. At this point, there is no tendency for price to change unless an external factor shifts demand or supply.
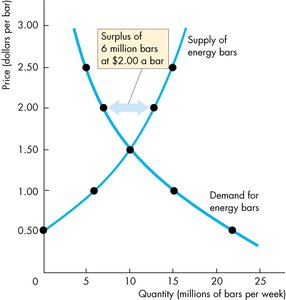
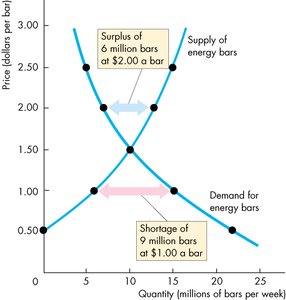
At prices above equilibrium, a surplus exists, putting downward pressure on price.
At prices below equilibrium, a shortage exists, putting upward pressure on price.
Adjustments to Equilibrium
When demand or supply shifts, the market moves to a new equilibrium. The process involves:
Identifying which curve shifts (demand, supply, or both).
Determining the direction of the shift (right for increase, left for decrease).
Comparing the initial and new equilibrium to analyze changes in price and quantity.
Applications and Examples
Technological Advances and Market Effects
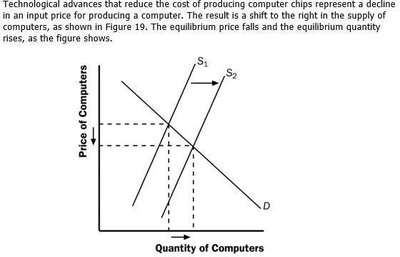
Technological improvements can reduce production costs, shifting the supply curve to the right. This typically lowers equilibrium price and increases equilibrium quantity. Related markets (complements and substitutes) are also affected.
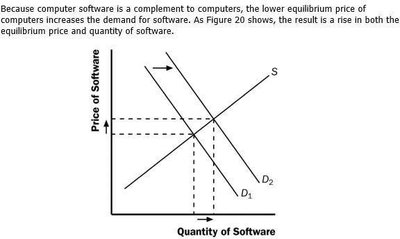
Example: Advances in computer chip technology increase the supply of computers, lower their price, and increase quantity sold. The demand for computer software (a complement) rises, while the demand for typewriters (a substitute) falls.

Market for Sweatshirts: Effects of External Events
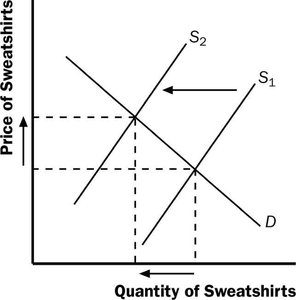
Supply shock: A hurricane damaging the cotton crop shifts the supply curve for sweatshirts to the left, raising price and lowering quantity.
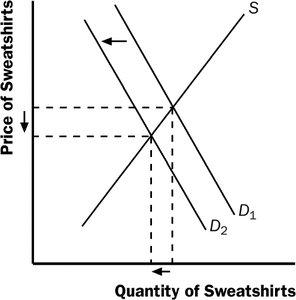
Substitute price change: A fall in the price of leather jackets (a substitute) reduces demand for sweatshirts, shifting the demand curve left and lowering both price and quantity.
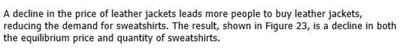
Increased demand: If all colleges require morning exercise in appropriate attire, demand for sweatshirts increases, shifting the demand curve right and raising both price and quantity.
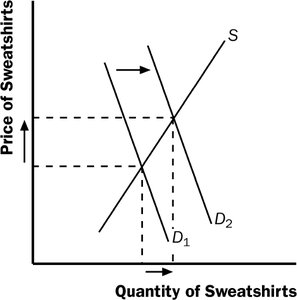
Technological improvement: New knitting machines increase supply, shifting the supply curve right and lowering price while increasing quantity.
Summary Table: Demand and Supply Shifters
Factor | Effect on Demand | Effect on Supply |
|---|---|---|
Price of the good | Movement along curve | Movement along curve |
Income | Normal: Demand ↑ with income ↑ Inferior: Demand ↓ with income ↑ | No direct effect |
Prices of related goods | Substitutes: Price ↑ → Demand ↑ Complements: Price ↑ → Demand ↓ | Related goods in production: Price ↑ → Supply ↓ (if alternative is more profitable) |
Technology | No direct effect | Improvement → Supply ↑ |
Number of buyers/sellers | Buyers ↑ → Demand ↑ | Sellers ↑ → Supply ↑ |
Expectations | Future price ↑ → Demand ↑ now | Future price ↑ → Supply ↓ now |
Key Equations
Market demand (horizontal summation):
Market supply (horizontal summation):
Profit maximization (competitive firm):
Conclusion
Understanding demand, supply, and market equilibrium is essential for analyzing how prices and quantities are determined in competitive markets. Shifts in demand or supply, caused by various factors, lead to new equilibrium outcomes. Mastery of these concepts provides the foundation for further study in microeconomics.
