 Back
Demand, Supply, and Price: Microeconomics Study Notes
Study Guide - Smart Notes
 Tailored notes based on your materials, expanded with key definitions, examples, and context.
Demand, Supply, and Price
Demand
The concept of demand is central to microeconomics, describing how much of a product consumers are willing and able to purchase at various prices over a given period. Understanding demand helps explain consumer behavior and market dynamics.
Quantity Demanded: The total amount that consumers desire to purchase in a specific time period. It is a flow variable, not a stock.
Quantity Bought: Refers to actual purchases, which may differ from quantity demanded.
Law of Demand: Ceteris paribus (all else equal), the price of a product and the quantity demanded are negatively related. As price decreases, quantity demanded increases.
Reason: Lower prices make it cheaper to satisfy a specific desire, encouraging consumers to buy more.
Demand Schedules and Demand Curves
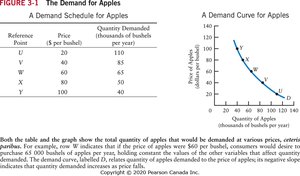
A demand schedule is a table showing the quantity demanded at different prices. The demand curve is a graphical representation of this relationship, typically downward sloping.
Variables Affecting Demand: Income, prices of other goods, tastes, population, and weather can shift the demand curve.
Shifts vs. Movements: A shift in the demand curve indicates a change in demand (due to factors other than price), while a movement along the curve indicates a change in quantity demanded (due to price change).
Example: The demand for apples at various prices is shown in the table and graph below.
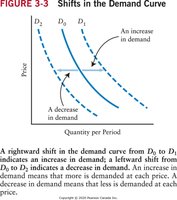
Shifts in the Demand Curve
Changes in factors other than price cause the demand curve to shift. A rightward shift indicates an increase in demand, while a leftward shift indicates a decrease.
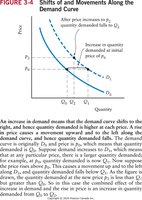
Shifts of and Movements Along the Demand Curve
A change in demand refers to a shift of the entire curve, while a change in quantity demanded refers to a movement along a given demand curve. This distinction is crucial for analyzing market responses to different variables.
Supply
Supply describes how much of a product firms are willing and able to sell at various prices over a given period. It is a fundamental concept for understanding producer behavior and market equilibrium.
Quantity Supplied: The amount that firms desire to sell in a specific time period. It is a flow variable.
Law of Supply: Ceteris paribus, the price of a product and the quantity supplied are positively related. As price increases, quantity supplied increases.
Reason: Higher prices make production more profitable, incentivizing firms to supply more.
Supply Schedules and Supply Curves
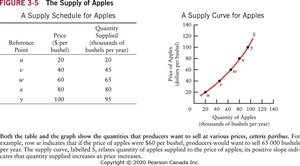
A supply schedule is a table showing the quantity supplied at different prices. The supply curve is a graphical representation, typically upward sloping.
Variables Affecting Supply: Prices of inputs, technology, taxes/subsidies, prices of other products, weather, and number of suppliers can shift the supply curve.
Shifts vs. Movements: A shift in the supply curve indicates a change in supply (due to factors other than price), while a movement along the curve indicates a change in quantity supplied (due to price change).
Example: The supply of apples at various prices is shown in the table and graph below.
Shifts in the Supply Curve
Changes in factors other than price cause the supply curve to shift. For example, technological innovation can increase supply at every price.
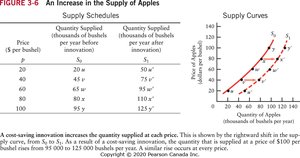
Shifts of and Movements Along the Supply Curve
A change in supply refers to a shift of the entire curve, while a change in quantity supplied refers to a movement from one point to another on the curve.
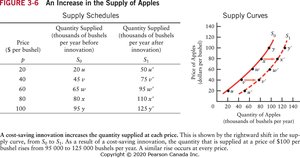
The Determination of Price
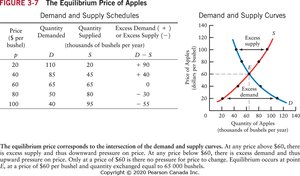
Market price is determined by the interaction of demand and supply. The equilibrium price is where the quantity demanded equals the quantity supplied, and the market "clears."
Market: Any situation in which buyers and sellers negotiate the transaction of goods or services.
Perfect Competition: Buyers and sellers are price takers; no single participant can influence the market price.
Equilibrium: At the equilibrium price, every buyer finds a seller and every seller finds a buyer.
Example: The equilibrium price for apples is shown in the table and graph below.
Changes in Market Prices
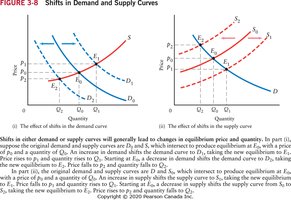
Shifts in demand or supply curves lead to changes in equilibrium price and quantity. The four possible curve shifts are:
An increase in demand increases both equilibrium price and quantity.
A decrease in demand decreases both equilibrium price and quantity.
An increase in supply decreases equilibrium price and increases equilibrium quantity.
A decrease in supply increases equilibrium price and decreases equilibrium quantity.
Relative Prices
Relative price is the price of one good in terms of another, as opposed to absolute price (the monetary cost of acquiring one unit). Demand and supply curves are typically drawn in terms of relative prices.
Applying Economic Concepts
Supply and demand models can be used to analyze real-world markets, such as the impact of the pandemic on gasoline prices, the cruise industry, and the toilet paper market.
Conditions for Price Determination: For the demand-and-supply model to accurately describe price determination, three conditions must be met:
Large number of consumers, each small relative to the market.
Large number of producers, each small relative to the market.
Producers must sell homogeneous versions of the product.
Key Formulas
Demand Function: Where is quantity demanded, is price, is income, is price of other goods, is tastes, is population, is weather.
Supply Function: Where is quantity supplied, is price, is price of inputs, is technology, is taxes/subsidies, is price of other products, is number of suppliers, is weather.
Equilibrium Condition:
Summary Table: Demand vs. Supply
Aspect | Demand | Supply |
|---|---|---|
Relationship with Price | Negative | Positive |
Curve Slope | Downward | Upward |
Shift Factors | Income, tastes, prices of other goods, population, weather | Input prices, technology, taxes/subsidies, prices of other products, number of suppliers, weather |
Movement | Change in quantity demanded (price change) | Change in quantity supplied (price change) |
Shift | Change in demand (other factors) | Change in supply (other factors) |
Additional info: Academic context and formulas have been added to ensure completeness and clarity for exam preparation.
