 Back
BackEconomic Efficiency, Government Price Setting, and Taxes
Study Guide - Smart Notes
 Tailored notes based on your materials, expanded with key definitions, examples, and context.
Economic Efficiency, Government Price Setting, and Taxes
Introduction
This unit explores how economic efficiency is achieved in competitive markets, the effects of government interventions such as price floors, price ceilings, and taxes, and how these policies impact consumer surplus, producer surplus, and overall welfare. Understanding these concepts is essential for analyzing real-world market outcomes and policy debates in microeconomics.
Economic Surplus: Consumer and Producer Surplus
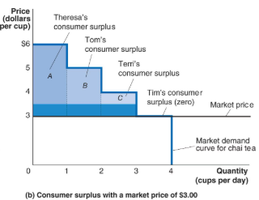
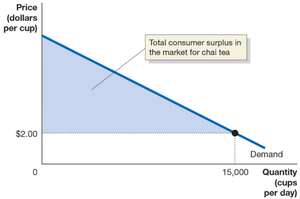
Consumer Surplus
Consumer surplus is the difference between the highest price a consumer is willing to pay for a good or service and the actual price paid. It measures the net benefit to consumers from market participation.
Marginal benefit: The additional benefit from consuming one more unit of a good or service.
Consumers purchase up to the point where marginal benefit equals price.
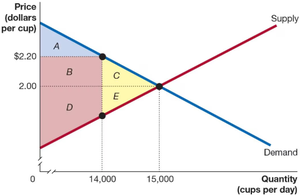
The total consumer surplus in a market is the area below the demand curve and above the market price.
Example: If you are willing to pay $6.99 to rent a movie but pay $4.99, your consumer surplus is $2.00.

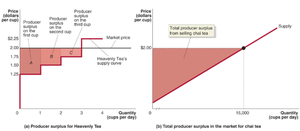
Producer Surplus
Producer surplus is the difference between the lowest price a firm is willing to accept for a good or service and the price it actually receives. It measures the net benefit to producers from market participation.
Marginal cost: The change in total cost from producing one more unit.
Firms supply additional units only if price covers marginal cost.
The total producer surplus in a market is the area above the supply curve and below the market price.
Example: If the marginal cost of producing a cup of tea is $1.25 and the market price is $2.00, the producer surplus for that cup is $0.75.
Economic Surplus
Economic surplus is the sum of consumer surplus and producer surplus. It is maximized at the competitive market equilibrium and serves as a measure of the total benefit to society from the production and consumption of a good or service.
Economic surplus is maximized when the market is in equilibrium, with no government restrictions.
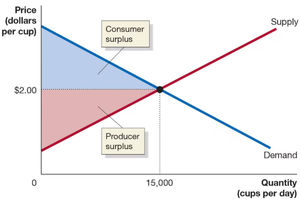
The Efficiency of Competitive Markets
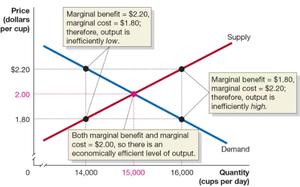
Marginal Benefit Equals Marginal Cost in Competitive Equilibrium
In a competitive market, efficiency is achieved when the marginal benefit to consumers equals the marginal cost of production. This occurs at the equilibrium price and quantity.
The demand curve represents marginal benefit; the supply curve represents marginal cost.
At equilibrium, every unit where marginal benefit exceeds marginal cost is produced and sold.
Deadweight Loss
Deadweight loss is the reduction in economic surplus resulting from a market not being in competitive equilibrium, often due to price controls or taxes.
Occurs when the quantity traded is less than or greater than the equilibrium quantity.
Represents lost welfare that neither consumers nor producers receive.
Government Intervention: Price Floors and Price Ceilings
Price Floors
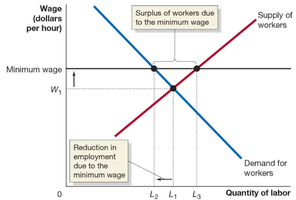
A price floor is a legally determined minimum price that sellers may receive. It is binding only if set above the equilibrium price.
Common in agricultural and labor markets (e.g., minimum wage).
Results in a surplus if the floor is above equilibrium.
Producer surplus may increase, but consumer surplus falls and deadweight loss arises.
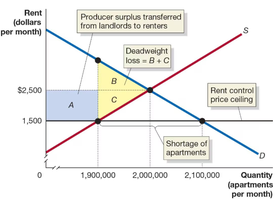
Price Ceilings
A price ceiling is a legally determined maximum price that sellers may charge. It is binding only if set below the equilibrium price.
Common in housing markets (e.g., rent control).
Results in a shortage if the ceiling is below equilibrium.
Producer surplus falls, some is transferred to consumers, and deadweight loss arises.
Illegal Markets and Peer-to-Peer Sites
When price controls are imposed, illegal markets may arise as buyers and sellers seek to evade regulations. Online platforms can facilitate such transactions, undermining the effectiveness of price controls.
Winners, Losers, and Economic Efficiency
Some consumers or producers benefit from price controls, while others lose.
Overall, economic efficiency is reduced due to deadweight loss.
Positive vs. Normative Analysis
Positive analysis: Describes what is (objective outcomes).
Normative analysis: Describes what should be (value judgments).
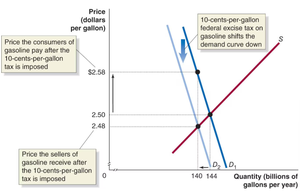
The Economic Effect of Taxes
Taxes and Market Equilibrium
When the government imposes a tax on a good or service, it shifts the supply or demand curve, resulting in a new equilibrium with a higher price for consumers, a lower price for producers, and a reduced quantity traded.
Taxes reduce economic efficiency by creating deadweight loss (excess burden).
Some consumer and producer surplus is converted to government tax revenue.
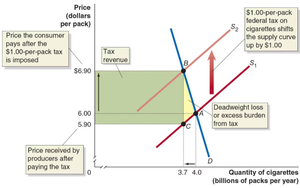
Tax Incidence
Tax incidence refers to the actual division of the burden of a tax between buyers and sellers, regardless of who is legally responsible for paying the tax.
The burden depends on the relative elasticities of demand and supply.
Whether the tax is collected from buyers or sellers, the economic outcome is the same.
Appendix: Quantitative Demand and Supply Analysis
Demand and Supply Equations
Market equilibrium can be found by setting the quantity demanded equal to the quantity supplied using their respective equations.
Example: For apartments in NYC, if $Q_D = 4,750,000 - 1,000P$ and $Q_S = -1,000,000 + 1,300P$, set $Q_D = Q_S$ to solve for equilibrium price $P$.
$4,750,000 - 1,000P = -1,000,000 + 1,300P$ $5,750,000 = 2,300P$ $P = \frac{5,750,000}{2,300} = 2,500$
Substitute $P$ back into either equation to find equilibrium quantity.
Calculating Consumer and Producer Surplus
Consumer surplus is the area below the demand curve and above the price; producer surplus is the area above the supply curve and below the price. These can be calculated using geometry or calculus, depending on the shape of the curves.
Summary Table: Surplus and Deadweight Loss
At Competitive Equilibrium | At a Price of $2.20 | |
|---|---|---|
Consumer surplus | A + B + C | A |
Producer surplus | D + E | B + D |
Deadweight loss | None | C + E |
Additional info: The above notes integrate textbook-level explanations, examples, and visual aids to reinforce key microeconomic concepts related to market efficiency, government intervention, and tax incidence.
