 Back
Economic Efficiency, Government Price Setting, and Taxes: Microeconomics Study Notes
Study Guide - Smart Notes
 Tailored notes based on your materials, expanded with key definitions, examples, and context.
Economic Efficiency, Government Price Setting, and Taxes
4.1 Consumer Surplus and Producer Surplus
Understanding consumer and producer surplus is essential for analyzing the benefits that buyers and sellers receive from participating in markets. These concepts help measure the net gains from trade and are foundational for evaluating market efficiency and the effects of government intervention.
Consumer Surplus: The difference between the highest price a consumer is willing to pay for a good or service and the actual price paid. It represents the net benefit to consumers from market participation.
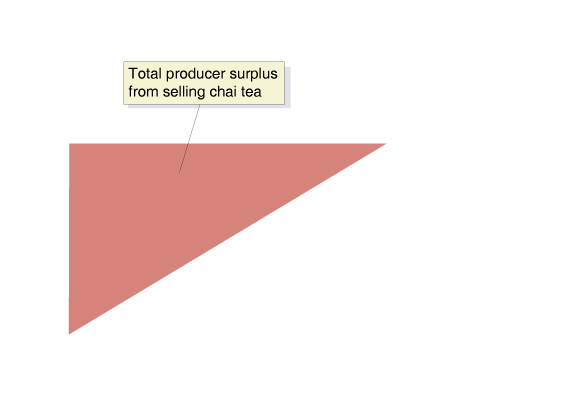
Producer Surplus: The difference between the lowest price a firm would accept for a good or service (typically the marginal cost of production) and the price it actually receives. It measures the net benefit to producers.
Marginal Benefit: The additional benefit to a consumer from consuming one more unit of a good or service.
Marginal Cost: The additional cost to a firm of producing one more unit of a good or service.
Graphical Representation: Consumer surplus is the area below the demand curve and above the market price, while producer surplus is the area above the supply curve and below the market price.
Example: In the market for chai tea, consumer and producer surplus can be calculated using the areas under the demand and above the supply curves, respectively.
4.2 The Efficiency of Competitive Markets
Economic efficiency in markets is achieved when resources are allocated in a way that maximizes total net benefit to society. This occurs when the sum of consumer and producer surplus (economic surplus) is at its highest possible value.
Economic Efficiency: A market outcome where the marginal benefit to consumers of the last unit produced equals its marginal cost, and the sum of consumer and producer surplus is maximized.
Competitive Equilibrium: The point where the demand and supply curves intersect, ensuring that all mutually beneficial trades occur and no deadweight loss exists.
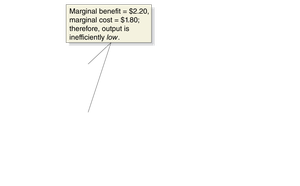
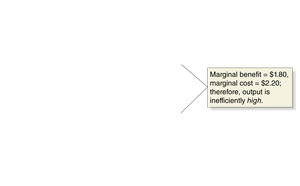
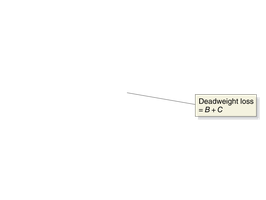
Deadweight Loss: The reduction in economic surplus resulting from a market not being in competitive equilibrium. It represents the value of trades that do not occur due to inefficiency.
Example: If the price is set above or below equilibrium, either too few or too many units are traded, resulting in deadweight loss.
4.3 Government Intervention in the Market: Price Floors and Price Ceilings
Governments may intervene in markets by imposing price floors (minimum prices) or price ceilings (maximum prices). These interventions can lead to surpluses, shortages, and deadweight loss, affecting both consumers and producers.
Price Ceiling: A legally determined maximum price that sellers can charge (e.g., rent control).
Price Floor: A legally determined minimum price that sellers may receive (e.g., minimum wage, agricultural price supports).
Effects of Price Floors: Can create surpluses (excess supply) and transfer surplus from consumers to producers, but also generate deadweight loss.
Effects of Price Ceilings: Can create shortages (excess demand), transfer surplus from producers to consumers, and generate deadweight loss.
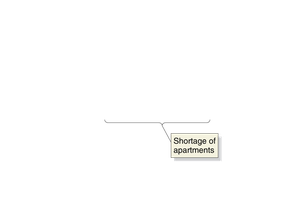
Example: Rent control leads to a shortage of apartments and a redistribution of surplus, but also causes deadweight loss due to reduced market activity.



4.4 The Economic Effect of Taxes
Taxes are a primary tool for government revenue but can also affect market outcomes by shifting supply or demand curves, altering equilibrium prices and quantities, and creating deadweight loss.
Per-Unit Tax: A tax assessed as a fixed dollar amount per unit sold (e.g., $1 per pack of cigarettes).
Tax Incidence: The actual division of the burden of a tax between buyers and sellers, determined by the relative elasticities of demand and supply, not by legal assignment.
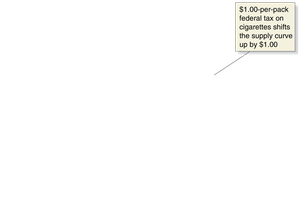
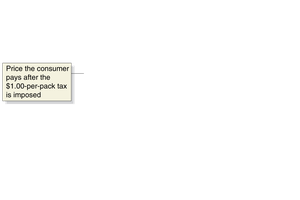
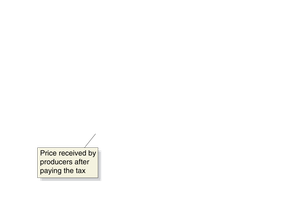
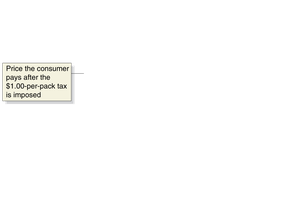
Effects of Taxes: Taxes shift the supply curve upward (or demand curve downward), increase the price paid by consumers, decrease the price received by producers, and reduce the quantity traded.
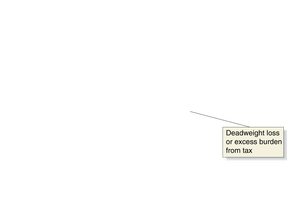
Deadweight Loss from Taxation: Some consumer and producer surplus is converted to government revenue, but some is lost entirely as deadweight loss.
Example: A $1-per-pack tax on cigarettes shifts the supply curve up, raises the market price, reduces quantity sold, and generates government revenue but also deadweight loss.
Appendix: Quantitative Demand and Supply Analysis
Quantitative analysis allows for the calculation of equilibrium price and quantity, as well as the measurement of consumer surplus, producer surplus, and deadweight loss using algebraic demand and supply equations.
Equilibrium Condition:
Solving for Equilibrium: Set the demand and supply equations equal and solve for price and quantity.
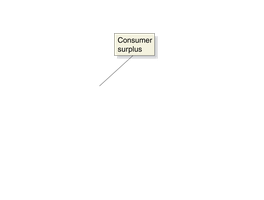
Consumer Surplus (CS): Area below the demand curve and above the price, calculated as the area of a triangle:
Producer Surplus (PS): Area above the supply curve and below the price, also calculated as a triangle.
Deadweight Loss (DWL): The area representing lost surplus due to market interventions (e.g., price controls).
Example: For New York City apartments, with and , equilibrium price and quantity can be found algebraically, and the effects of rent control can be quantified.





Key Formulas
Consumer Surplus (CS):
Producer Surplus (PS):
Deadweight Loss (DWL):
Additional info: These formulas assume linear demand and supply curves. For more complex cases, integration may be required.
