 Back
Economic Efficiency, Government Price Setting, and Taxes: Study Notes
Study Guide - Smart Notes
 Tailored notes based on your materials, expanded with key definitions, examples, and context.
Economic Efficiency, Government Price Setting, and Taxes
Chapter Overview
This chapter explores how markets allocate resources efficiently, the concepts of consumer and producer surplus, and the effects of government interventions such as price floors, price ceilings, and taxes. It also includes quantitative analysis of demand and supply and the resulting economic outcomes.
Consumer Surplus and Producer Surplus
Definitions and Measurement
Consumer Surplus: The difference between the highest price a consumer is willing to pay for a good or service and the actual price paid. It represents the net benefit to consumers from market participation.
Producer Surplus: The difference between the lowest price a firm would accept for a good or service (typically the marginal cost) and the price it actually receives. It measures the net benefit to producers.
Both surpluses are visualized as areas on the demand and supply curves:
Consumer surplus: Area below the demand curve and above the market price.
Producer surplus: Area above the supply curve and below the market price.
Marginal Benefit: The additional benefit to a consumer from consuming one more unit of a good or service. Marginal Cost: The additional cost to a firm of producing one more unit of a good or service.
Example: Chai Tea Market
If the price of chai tea is $3.50, consumers whose willingness to pay is above this price gain surplus equal to the difference.
If the price falls, consumer surplus increases as more consumers benefit.
Producer surplus is calculated similarly, based on the difference between market price and marginal cost for each unit sold.
The Efficiency of Competitive Markets
Economic Efficiency
A market is efficient if:
All trades occur where marginal benefit exceeds marginal cost, and no other trades take place.
The sum of consumer and producer surplus (economic surplus) is maximized.
At the competitive equilibrium, marginal benefit equals marginal cost, and economic surplus is at its maximum. Any deviation from equilibrium creates a deadweight loss, representing lost efficiency.
Government Intervention: Price Floors and Price Ceilings
Definitions
Price Ceiling: A legally determined maximum price sellers may charge (e.g., rent control).
Price Floor: A legally determined minimum price sellers may receive (e.g., minimum wage, agricultural price supports).
Economic Effects
Price floors above equilibrium create surpluses (excess supply).
Price ceilings below equilibrium create shortages (excess demand).
Both interventions reduce economic surplus and create deadweight loss.
Example: Rent Control and Minimum Wage
Rent ceilings reduce the quantity of apartments supplied and increase the quantity demanded, resulting in shortages and deadweight loss.
Minimum wage laws can increase incomes for some workers but may reduce employment and create deadweight loss.
Black Markets and Peer-to-Peer Sites
Shortages from price ceilings can lead to black markets, where goods are sold illegally at higher prices.
Peer-to-peer platforms (e.g., Airbnb) may emerge to circumvent controls, but often at the cost of legal protections.
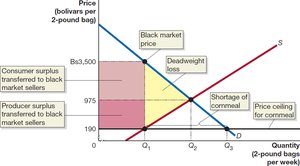
Case Study: Price Controls in Venezuela
Government-imposed price ceilings on food led to shortages and black markets, where goods were sold at much higher prices.
Consumer and producer surplus was transferred to black market sellers, and deadweight loss increased.
The Economic Effect of Taxes
Per-Unit Taxes
Taxes shift the supply curve upward by the amount of the tax, increasing the price paid by consumers and reducing the price received by producers.
Quantity traded decreases, and part of the consumer and producer surplus is converted to government tax revenue; the rest becomes deadweight loss.
Tax Incidence: The actual division of the tax burden between buyers and sellers depends on the relative elasticities (slopes) of demand and supply, not on who is legally responsible for paying the tax.
If demand is inelastic (steep), consumers bear more of the tax burden.
If supply is inelastic, producers bear more of the tax burden.
Example: Gasoline and Social Security Taxes
In the gasoline market, consumers may pay most of the tax if demand is inelastic.
For Social Security taxes, workers (sellers of labor) bear most of the burden if their labor supply is inelastic.
Appendix: Quantitative Demand and Supply Analysis
Solving for Equilibrium
Set the demand and supply equations equal to each other to solve for equilibrium price and quantity.
Calculate consumer and producer surplus using the area of triangles under the demand and above the supply curves, respectively.
Effect of Rent Controls (Numerical Example)
Imposing a rent ceiling reduces the quantity of apartments rented, changes consumer and producer surplus, and creates deadweight loss.
Numerical calculations can estimate the magnitude of these effects.
Summary Table: Effects of Rent Controls
Outcome | Before Control | After Control | Change |
|---|---|---|---|
Consumer Surplus | $2,531.25 million | (calculated value) | (difference) |
Producer Surplus | $1,947.375 million | (calculated value) | (difference) |
Deadweight Loss | $0 | $1,495 million | +$1,495 million |
Additional info: Values for 'After Control' and 'Change' are determined by the specific rent ceiling imposed and the resulting market adjustments.
Key Formulas
Consumer Surplus (CS):
Producer Surplus (PS):
Economic Surplus:
Deadweight Loss (DWL):
Conclusion
Understanding consumer and producer surplus, economic efficiency, and the effects of government interventions is essential for analyzing real-world markets. Quantitative tools allow economists to measure the impact of policies such as price controls and taxes, providing valuable insights for policy decisions.
