 Back
BackElasticity, Demand, and Supply in Microeconomics: Study Notes
Study Guide - Smart Notes
 Tailored notes based on your materials, expanded with key definitions, examples, and context.
Elasticity in Microeconomics
Price Elasticity of Demand
The price elasticity of demand measures how much the quantity demanded of a good responds to a change in its price. It is a key concept for understanding consumer behavior and market dynamics.
Formula: The price elasticity of demand (Ed) is calculated as:
Elastic Demand: |Ed| > 1 (quantity demanded changes more than price)
Inelastic Demand: |Ed| < 1 (quantity demanded changes less than price)
Unit Elastic: |Ed| = 1 (quantity demanded changes exactly as price changes)
Perfectly Elastic: Ed = ∞ (horizontal demand curve)
Perfectly Inelastic: Ed = 0 (vertical demand curve)
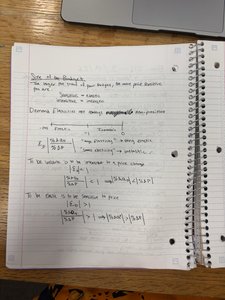
Determinants of Elasticity
Several factors influence the elasticity of demand:
Availability of Substitutes: More substitutes make demand more elastic.
Necessity vs. Luxury: Necessities tend to have inelastic demand; luxuries are more elastic.
Time Horizon: Demand is more elastic in the long run as consumers adjust their behavior.
Definition of the Market: Narrowly defined markets have more elastic demand.

Supply and Demand: Shifts and Equilibrium
Short-Run vs. Long-Run Supply
Supply can be more or less elastic depending on the time frame considered. In the short run, firms have limited ability to change production, while in the long run, they can adjust all inputs.
Short Run: Some inputs are fixed; supply is less elastic.
Long Run: All inputs can be varied; supply is more elastic.
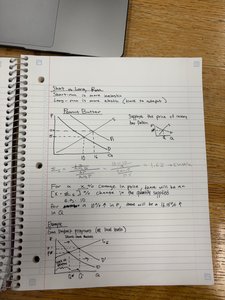
Shifts in Demand and Supply
Market equilibrium is determined by the intersection of demand and supply. Shifts in either curve can change the equilibrium price and quantity.
Increase in Demand: Shifts the demand curve right, raising equilibrium price and quantity.
Increase in Supply: Shifts the supply curve right, lowering equilibrium price and raising quantity.
Simultaneous Shifts: The effect on equilibrium depends on the magnitude of each shift.

Consumer and Producer Surplus
Consumer surplus is the difference between what consumers are willing to pay and what they actually pay. Producer surplus is the difference between the price received by sellers and their minimum acceptable price.
Graphical Representation: Consumer surplus is the area above the price and below the demand curve; producer surplus is below the price and above the supply curve.

Elasticity and Total Revenue
Relationship Between Elasticity and Total Revenue
Total revenue (TR) is calculated as price times quantity sold. The effect of a price change on total revenue depends on the elasticity of demand:
Elastic Demand: Price increase lowers total revenue; price decrease raises total revenue.
Inelastic Demand: Price increase raises total revenue; price decrease lowers total revenue.
Income and Cross-Price Elasticity
Income Elasticity of Demand
The income elasticity of demand measures how quantity demanded changes as consumer income changes.
Normal Goods: EI > 0 (demand increases as income rises)
Inferior Goods: EI < 0 (demand decreases as income rises)
Cross-Price Elasticity of Demand
The cross-price elasticity of demand measures how the quantity demanded of one good responds to a change in the price of another good.
Substitutes: Exy > 0
Complements: Exy < 0
Effects of Elasticity on Economic Outcomes
Tax Incidence and Elasticity
The burden of a tax (tax incidence) depends on the relative elasticities of supply and demand. The side of the market that is less elastic bears more of the tax burden.
More Elastic Supply: Consumers bear more of the tax burden.
More Elastic Demand: Producers bear more of the tax burden.

Consumer and Producer Surplus with Taxes
Taxes create a wedge between the price buyers pay and the price sellers receive, reducing both consumer and producer surplus and creating deadweight loss.
Deadweight Loss: The reduction in total surplus due to the tax.
Summary Table: Elasticity Concepts
Elasticity Type | Formula | Interpretation |
|---|---|---|
Price Elasticity of Demand | Responsiveness of quantity demanded to price changes | |
Income Elasticity of Demand | Responsiveness of quantity demanded to income changes | |
Cross-Price Elasticity | Responsiveness of demand for one good to price changes in another |
Graphical Analysis of Elasticity
Graphing Elastic and Inelastic Curves
Elasticity can be visualized using the slope of demand and supply curves. Flatter curves indicate greater elasticity, while steeper curves indicate inelasticity.
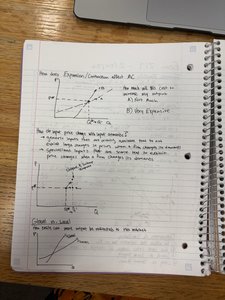
Expansion/Contraction Effects on Average Cost
Changes in production scale can affect average costs. Expansion may lower average costs due to economies of scale, while contraction can increase costs.
Economies of Scale: Average cost decreases as output increases.
Diseconomies of Scale: Average cost increases as output increases.
Conclusion
Understanding elasticity is crucial for analyzing market outcomes, predicting the effects of policy changes, and making informed business decisions. Mastery of these concepts provides a strong foundation for further study in microeconomics.
