 Back
Elasticity, Efficiency, and Surplus in Microeconomics
Study Guide - Smart Notes
 Tailored notes based on your materials, expanded with key definitions, examples, and context.
Elasticity
Price Elasticity of Demand
Price elasticity of demand measures how responsive the quantity demanded of a good is to changes in its price. It is calculated as the ratio of the percentage change in quantity demanded to the percentage change in price.
Formula:
Mid-point formula:
Classification:
Elastic: Elasticity > 1
Unit Elastic: Elasticity = 1
Inelastic: Elasticity < 1
Interpretation:
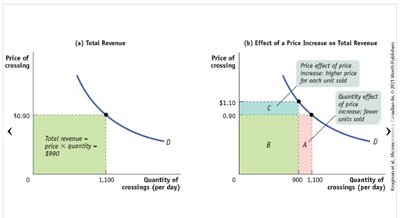
A price effect occurs when a price increase raises revenue per unit.
A quantity effect occurs when a price increase reduces the number of units sold, decreasing revenue.
Example: If the price of phones rises from $200 to $210 and quantity demanded falls from 10 to 9.9, use the mid-point formula to calculate elasticity.
Factors Determining Price Elasticity of Demand
Necessity vs. luxury
Availability of close substitutes
Proportion of income spent on the good
Time elapsed since price change
Cross-Price Elasticity of Demand
Cross-price elasticity measures the responsiveness of the quantity demanded of one good to changes in the price of another good.
Formula:
Example: If the price of potato chips rises from $2.5 to $3.5 and soda demand falls from 100 to 80 cans, calculate cross-price elasticity using the mid-point formula.
Income Elasticity of Demand
Income elasticity of demand measures how much the demand for a good changes as consumer income changes.
Formula:
Example: If income rises from $20,000 to $25,000 and badminton games played increase from 15 to 20, use the mid-point formula to calculate income elasticity.
Price Elasticity of Supply
Price elasticity of supply measures how responsive sellers are to changes in price.
Formula:
Classification:
Elastic: Elasticity > 1
Unit Elastic: Elasticity = 1
Inelastic: Elasticity < 1
Example: If lamp production rises from 30 to 50 units as price increases from $35 to $40, calculate elasticity.
Factors:
Availability of inputs
Time
Efficiency and Equity
Resource Allocation Methods
Resources can be allocated in various ways, each with different implications for efficiency and equity:
Market price
Command
Majority rule
Contest
First-come, first-serve
Lottery
Personal characteristics
Force
Benefit, Cost, and Surplus
Consumer surplus is the difference between the benefit consumers receive from a good and the price they pay. Producer surplus is the difference between the market price and the cost to producers. Total surplus is the sum of consumer and producer surplus at market equilibrium.
Consumer Surplus:
Different individuals have different willingness to pay.
Market price reduces individual consumer surplus by the amount paid.
Producer Surplus:
Different sellers have different costs.
Producer surplus increases with price increases and decreases with price decreases.
Total Surplus:
At equilibrium, total surplus is maximized.
Efficiency is achieved when no one can be made better off without making someone else worse off.
Inefficiencies and Deadweight Loss
Sources of Market Failure
Market failures occur when resources are not allocated efficiently, resulting in deadweight loss. Common sources include:
Price and quantity regulations
Taxes and subsidies
Externalities
Public goods and common resources
Monopoly
High transaction costs
Appendix: Demand and Supply Curves
Individual and Market Demand Curves
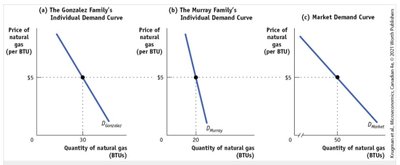
Individual demand curves show the relationship between price and quantity demanded for a single consumer, while the market demand curve aggregates all individual demand curves.
Individual and Market Supply Curves
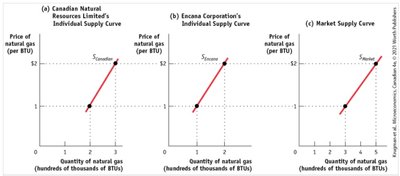
Individual supply curves show the relationship between price and quantity supplied for a single producer, while the market supply curve aggregates all individual supply curves.
Demand Curve for Used Textbooks
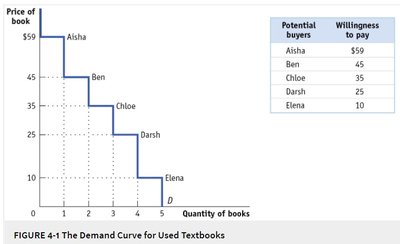
The demand curve for used textbooks illustrates how different buyers have varying willingness to pay, which forms a stepwise demand curve.
Potential Buyer | Willingness to Pay |
|---|---|
Aisha | $59 |
Ben | $45 |
Chloe | $35 |
Darsh | $25 |
Elena | $10 |
