 Back
Elasticity in Microeconomics: Price, Income, Cross, and Supply Elasticities
Study Guide - Smart Notes
 Tailored notes based on your materials, expanded with key definitions, examples, and context.
Elasticity
Introduction to Elasticity
Elasticity is a fundamental concept in microeconomics that measures the responsiveness of one variable to changes in another. In this chapter, we focus on price elasticity of demand, income elasticity of demand, cross elasticity of demand, and elasticity of supply. Understanding elasticity helps explain how consumers and producers react to changes in prices, incomes, and the prices of related goods.
Price Elasticity of Demand
Definition and Calculation
The price elasticity of demand quantifies how much the quantity demanded of a good responds to a change in its price, holding all other factors constant. It is a units-free measure, meaning it is not affected by the units in which price or quantity are measured.
Formula:
Percentage change in quantity:
Percentage change in price:
Elasticity is typically negative, as price and quantity move in opposite directions, but the focus is on the absolute value.
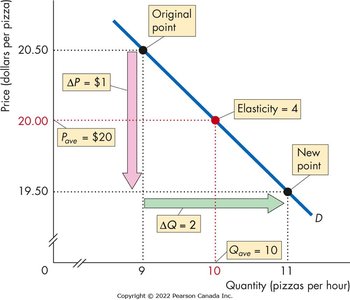
Example: If the price of pizza falls from $20.50 to $19.50 and quantity demanded rises from 9 to 11 pizzas per hour:
, ,
, ,
Elasticity =
Categorizing Elasticity
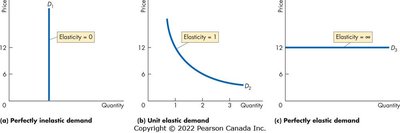
Elasticity values are interpreted to classify demand as inelastic, unit elastic, elastic, perfectly inelastic, or perfectly elastic. These categories reflect how responsive quantity demanded is to price changes.
Perfectly inelastic: Elasticity = 0; quantity demanded does not change with price (vertical demand curve).
Unit elastic: Elasticity = 1; percentage change in quantity equals percentage change in price.
Inelastic: Elasticity < 1 but > 0; quantity demanded changes less than price.
Elastic: Elasticity > 1; quantity demanded changes more than price.
Perfectly elastic: Elasticity = infinity; any price change causes an infinite change in quantity (horizontal demand curve).
Elasticity Along a Linear Demand Curve
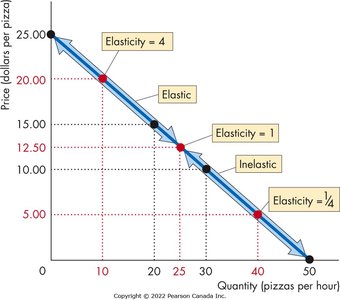
Elasticity varies along a linear demand curve. At the midpoint, demand is unit elastic. Above the midpoint, demand is elastic; below, it is inelastic.
Elasticity is not constant along a straight-line demand curve.
Examples show how elasticity changes as price and quantity move along the curve.
Factors Influencing Elasticity of Demand
Three main factors determine the elasticity of demand for a good:
Closeness of Substitutes: More substitutes make demand more elastic.
Proportion of Income Spent: Goods that take up a larger share of income have more elastic demand.
Time Elapsed Since Price Change: Demand becomes more elastic over time as consumers adjust.
Necessities tend to have inelastic demand, while luxuries are more elastic.
Total Revenue and Elasticity
Total revenue is the product of price and quantity sold. The effect of price changes on total revenue depends on the elasticity of demand:
If demand is elastic, a price decrease increases total revenue.
If demand is inelastic, a price decrease decreases total revenue.
If demand is unit elastic, total revenue remains unchanged with price changes.
More Elasticities of Demand
Income Elasticity of Demand
The income elasticity of demand measures how quantity demanded responds to changes in income, holding other factors constant.
Formula:
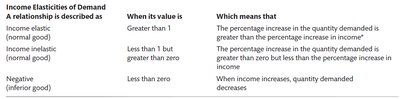
If elasticity > 1: demand is income elastic (normal good).
If elasticity > 0 but < 1: demand is income inelastic (normal good).
If elasticity < 0: the good is inferior (demand decreases as income rises).
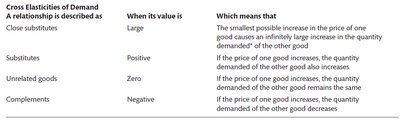
Cross Elasticity of Demand
The cross elasticity of demand measures the responsiveness of demand for one good to changes in the price of another good.
Formula:
Positive cross elasticity: goods are substitutes.
Negative cross elasticity: goods are complements.
Zero cross elasticity: goods are unrelated.
Elasticity of Supply
Definition and Calculation
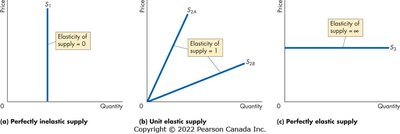
The elasticity of supply measures how much the quantity supplied of a good responds to a change in its price, holding other factors constant.
Formula:
Elasticity can be perfectly inelastic, inelastic, unit elastic, elastic, or perfectly elastic.
Summary Table: Elasticities
The following tables summarize the main types of elasticities and their interpretations:
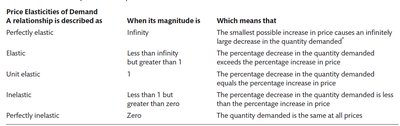
Price Elasticity of Demand | Magnitude | Interpretation |
|---|---|---|
Perfectly elastic | Infinity | Smallest price increase causes infinite decrease in quantity demanded |
Elastic | >1 | Percentage decrease in quantity demanded exceeds percentage increase in price |
Unit elastic | 1 | Percentage decrease in quantity equals percentage increase in price |
Inelastic | <1 but >0 | Percentage decrease in quantity is less than percentage increase in price |
Perfectly inelastic | 0 | Quantity demanded is the same at all prices |
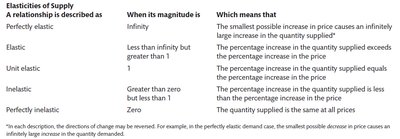
Elasticity of Supply | Magnitude | Interpretation |
|---|---|---|
Perfectly elastic | Infinity | Smallest price increase causes infinite increase in quantity supplied |
Elastic | >1 | Percentage increase in quantity supplied exceeds percentage increase in price |
Unit elastic | 1 | Percentage increase in quantity equals percentage increase in price |
Inelastic | <1 but >0 | Percentage increase in quantity is less than percentage increase in price |
Perfectly inelastic | 0 | Quantity supplied is the same at all prices |
Additional info: Academic context and examples were added to clarify definitions, formulas, and applications. Tables were recreated and expanded for clarity. All images included are directly relevant to the explanation of elasticity concepts.
