 Back
BackChapter 6
Study Guide - Smart Notes
 Tailored notes based on your materials, expanded with key definitions, examples, and context.
Chapter 6 – Elasticity: The Responsiveness of Demand and Supply
Introduction to Elasticity
Elasticity is a fundamental concept in microeconomics that measures how much one economic variable responds to changes in another. Most commonly, it is used to analyze how quantity demanded or supplied responds to changes in price, but it can also be applied to income and the prices of related goods. Understanding elasticity is crucial for making informed pricing and production decisions in real-world markets.
Price Elasticity of Demand
Definition and Formula
Price elasticity of demand measures the responsiveness of the quantity demanded of a good to a change in its price. It is calculated as the percentage change in quantity demanded divided by the percentage change in price:
Formula:
Using actual values:
Elasticity is typically negative due to the law of demand, but economists often use the absolute value when comparing elasticities.
Why Use Percentage Changes?
Elasticity uses percentage changes rather than slopes to avoid issues with units of measurement. This ensures that elasticity is comparable across different goods and markets, regardless of the units used for price or quantity.
The Midpoint Formula
To avoid discrepancies when moving between two points on a demand curve, the midpoint formula is used:
This formula gives the same elasticity value regardless of the direction of the change.
Interpreting Elasticity Values
Elastic Demand: Absolute value > 1. Quantity demanded is very responsive to price changes.
Inelastic Demand: Absolute value < 1. Quantity demanded is not very responsive to price changes.
Unit Elastic Demand: Absolute value = 1. Percentage change in quantity demanded equals percentage change in price.
Special Cases
Perfectly Inelastic Demand: Elasticity = 0. Quantity demanded does not change with price (vertical demand curve).
Perfectly Elastic Demand: Elasticity = ∞. Quantity demanded drops to zero with any price increase (horizontal demand curve).
Determinants of Price Elasticity of Demand
Several factors influence how responsive quantity demanded is to price changes:
Availability of Close Substitutes: More substitutes make demand more elastic.
Passage of Time: Demand becomes more elastic over time as consumers adjust their behavior.
Luxuries vs. Necessities: Luxuries tend to have more elastic demand; necessities are more inelastic.
Definition of the Market: Narrowly defined markets have more elastic demand.
Share of the Good in the Consumer’s Budget: Goods that take up a larger share of the budget have more elastic demand.
Elasticity and Total Revenue
Total revenue (TR) is the total amount received by sellers, calculated as price times quantity sold (). The relationship between elasticity and total revenue is crucial for pricing decisions:
When demand is inelastic, price and total revenue move in the same direction.
When demand is elastic, price and total revenue move in opposite directions.
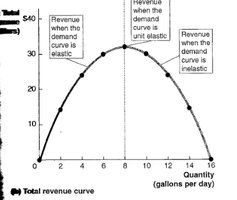
When demand is unit elastic, changes in price do not affect total revenue.
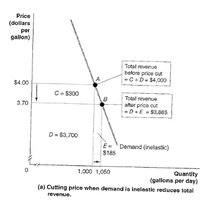
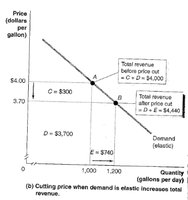
Graphical Analysis
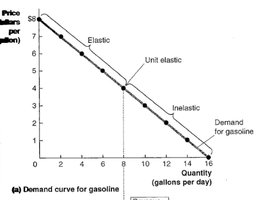
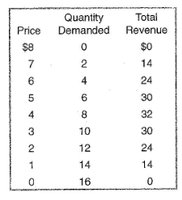
The relationship between elasticity and total revenue can be visualized using demand and total revenue curves. The demand curve can be divided into elastic, inelastic, and unit elastic regions. Total revenue is maximized where demand is unit elastic.
Other Demand Elasticities
Cross-Price Elasticity of Demand
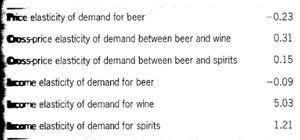
Cross-price elasticity of demand measures the responsiveness of the quantity demanded for one good to a change in the price of another good:
Positive value: Goods are substitutes.
Negative value: Goods are complements.
Zero: Goods are unrelated.
Income Elasticity of Demand
Income elasticity of demand measures the responsiveness of quantity demanded to changes in income:
Positive value: Normal good (demand increases as income rises).
Negative value: Inferior good (demand decreases as income rises).
For normal goods:
Elasticity > 1: Luxury
Elasticity < 1: Necessity
Price Elasticity of Supply
Definition and Formula
Price elasticity of supply measures the responsiveness of the quantity supplied to a change in price:
Elasticity > 1: Supply is elastic.
Elasticity < 1: Supply is inelastic.
Elasticity = 1: Supply is unit elastic.
Determinant of Price Elasticity of Supply
The primary determinant is time:
In the short run, supply is generally inelastic due to fixed resources.
In the long run, supply becomes more elastic as firms can adjust resources and production capacity.
Elasticity of Supply and Price Changes
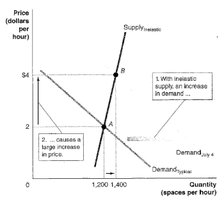
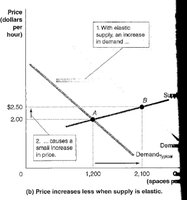
The elasticity of supply affects how much price changes when demand shifts. With inelastic supply, price increases more when demand rises; with elastic supply, price increases less.
Summary Table: Types of Elasticity
Elasticity Type | Formula | Interpretation |
|---|---|---|
Price Elasticity of Demand | Responsiveness of QD to price changes | |
Cross-Price Elasticity of Demand | Responsiveness of QD for one good to price changes of another | |
Income Elasticity of Demand | Responsiveness of QD to income changes | |
Price Elasticity of Supply | Responsiveness of QS to price changes |
Key Takeaways
Elasticity is a measure of responsiveness and is crucial for understanding market behavior.
Price elasticity of demand and supply guide pricing and production decisions.
Cross-price and income elasticities help classify goods and predict market interactions.
Elasticity is not the same as slope; it uses percentage changes to ensure comparability.
