 Back
BackChapter 12
Study Guide - Smart Notes
 Tailored notes based on your materials, expanded with key definitions, examples, and context.
Firms in Perfectly Competitive Markets
Introduction to Market Structures
Market structures describe the competitive environment in which firms operate. The four primary types, ranked from highest to lowest competition, are: perfectly competitive markets, monopolistic competition, oligopoly, and monopoly. Understanding perfectly competitive markets provides a foundation for analyzing other market structures.
Perfectly Competitive Markets: Many firms, identical products, no barriers to entry.
Monopolistic Competition: Many firms, differentiated products, few barriers to entry.
Oligopoly: Few firms, products may be identical or differentiated, significant barriers to entry.
Monopoly: One firm, unique product, high barriers to entry.
Economic vs. Accounting Profit
Profit measurement is central to firm decision-making. The distinction between economic and accounting profit is crucial for economic analysis.
Economic Profit: (where TC includes both explicit and implicit costs)
Accounting Profit: (where TC includes only explicit costs)
Economic profit is always less than or equal to accounting profit because it subtracts implicit costs. Economic profit is the relevant measure for firm entry and exit decisions.
Positive Economic Profit: Indicates the firm is earning more than its next best alternative; attracts entry if barriers are low.
Zero Economic Profit (Normal Profit): The firm is earning as much as its next best alternative; no incentive to enter or exit.
Negative Economic Profit: The firm could earn more elsewhere; signals exit in the long run.
Characteristics of Perfectly Competitive Markets
Defining Features
Perfectly competitive markets are defined by three main characteristics:
Many Buyers and Sellers: Each participant is too small to affect the market price.
Identical Products: Goods are perfect substitutes; no differentiation.
No Significant Barriers to Entry: Firms can freely enter or exit the market.
As a result, both firms and consumers are price takers—they must accept the market price determined by overall supply and demand.
Example: Agricultural markets, such as wheat or corn, closely approximate perfect competition.
Price Takers and Market Demand
In perfectly competitive markets, the actions of any single buyer or seller do not influence the market price. The market price is set by the intersection of market supply and demand. Individual firms face a perfectly elastic demand curve at the market price.
If a firm tries to charge more than the market price, it sells nothing.
If a consumer tries to pay less, they buy nothing.
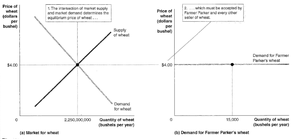
Graph Explanation: The left panel shows the market equilibrium price and quantity. The right panel shows the individual firm's demand curve, which is perfectly elastic at the market price.
Profit Maximization in Perfect Competition
Revenue Concepts
For a perfectly competitive firm, price (), marginal revenue (), and average revenue () are all equal and constant:
In perfect competition:
Firms maximize profit by producing the quantity where marginal revenue equals marginal cost ().
Marginal Analysis and Profit Maximization Rule
Optimal production occurs where the additional revenue from selling one more unit equals the additional cost of producing it:
If , increase output.
If , decrease output.
If , profit is maximized.
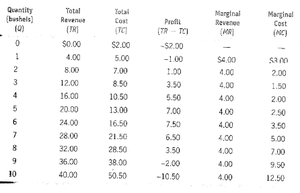
Table Explanation: This table shows how total revenue, total cost, profit, marginal revenue, and marginal cost change as output increases. The profit-maximizing output is where .
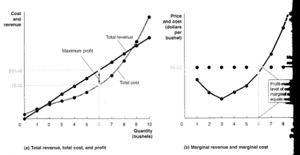
Graph Explanation: The left graph shows total revenue, total cost, and profit. The right graph shows marginal revenue and marginal cost, highlighting the profit-maximizing quantity.
Graphical Representation of Profit Maximization
The profit-maximizing output is where the firm's marginal cost curve intersects the marginal revenue (price) curve. The vertical distance between price and average total cost (ATC) at this quantity represents profit per unit. Total profit is calculated as:
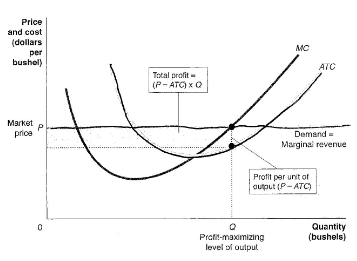
Graph Explanation: The shaded area represents total profit. If , the firm earns positive economic profit; if , the firm breaks even; if , the firm incurs a loss.
Short-Run vs. Long-Run Decisions
Short-Run Production Decisions
In the short run, at least one input is fixed. Firms must decide whether to continue producing or temporarily shut down if they are incurring losses.
If at the profit-maximizing output, the firm should continue to produce to minimize losses.
If , the firm should shut down temporarily, as it cannot cover its variable costs.
The firm's short-run supply curve is the portion of its marginal cost curve above the average variable cost curve.
Long-Run Entry and Exit
In the long run, all inputs are variable, and firms can enter or exit the market. Economic profits attract entry, while losses lead to exit. In long-run equilibrium:
Firms earn zero economic profit ().
Entry and exit ensure that only normal profit is earned.
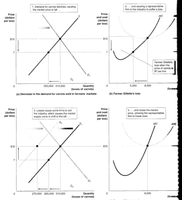
Graph Explanation: These graphs illustrate how short-run losses lead to firm exit and how the market adjusts to restore long-run equilibrium at zero economic profit.
Summary
Perfect competition is characterized by many firms, identical products, and free entry/exit.
Firms are price takers and maximize profit where .
Short-run losses may lead to temporary shutdowns, but fixed costs must still be paid.
Long-run entry and exit drive economic profit to zero, ensuring only normal profit remains.
Additional info: While perfectly competitive markets are rare in reality, they provide a useful benchmark for analyzing other market structures and understanding the forces of competition.
