 Back
BackFoundations of Microeconomics: Key Concepts and Graphical Analysis
Study Guide - Smart Notes
 Tailored notes based on your materials, expanded with key definitions, examples, and context.
Introduction to Economics
What is Economics?
Economics is the study of how individuals, firms, and societies make choices to allocate scarce resources in order to fulfill their unlimited wants. It is not solely about money, but rather a systematic way of thinking that helps explain many aspects of life, including decision-making and resource allocation.
Scarcity: The fundamental economic problem where unlimited wants exceed limited resources.
Opportunity Cost: The value of the next best alternative that must be forgone to obtain something else.
Trade-off: Choosing more of one good or service means producing less of another due to scarcity.

Additional info: Economics provides frameworks for understanding choices, incentives, and the consequences of resource allocation.
The Economic Problem Every Society Must Solve
Three Fundamental Questions
Scarcity forces societies to make choices regarding:
What to produce? Determined by the collective decisions of consumers, firms, and governments.
How to produce? Firms decide the methods of production, often trading off between labor and technology.
Who receives what is produced? Distribution depends on income and government policy.


Additional info: These questions are central to understanding economic systems and policy decisions.
Production Possibilities Frontier (PPF)
Definition and Application
The Production Possibilities Frontier (PPF) is a curve that illustrates the maximum combinations of two goods that can be produced with fixed resources and technology. It demonstrates trade-offs and opportunity costs.
PPF Table Example: Shows possible combinations of milk and cheese production.
Points on the PPF: Each point represents a specific allocation of resources.
Milk (Gallons) | Cheese (Pounds) | Point |
|---|---|---|
15 | 0 | A |
14 | 2 | B |
12 | 4 | C |
8 | 6 | D |
0 | 8 | E |
Additional info: Points inside the PPF are inefficient, points on the PPF are efficient, and points outside are unattainable.
Types of Economies
Economic Systems
Societies organize their economies in different ways to answer the three fundamental questions.
Centrally Planned Economy: The government allocates resources and makes production decisions.
Market Economy: Households and firms interact in markets to allocate resources.
Mixed Economy: Combines market mechanisms with significant government intervention.
Additional info: Most modern economies are mixed, balancing efficiency and equity.
Efficiency and Equity in Market Economies
Definitions and Trade-offs
Market economies are generally more efficient than centrally planned economies, but efficiency does not always equate to fairness.
Productive Efficiency: Producing goods at the lowest possible cost.
Allocative Efficiency: Resources are allocated so that the last unit produced provides a marginal benefit equal to its marginal cost ().
Equity: The fair distribution of economic benefits, often requiring government intervention.
Additional info: Policy decisions often involve trade-offs between efficiency and equity.
Economic Models and Scientific Method
Model Building and Analysis
Economists use models to simplify reality and analyze economic phenomena. Models are based on assumptions and tested through hypotheses.
Positive Analysis: Describes what is.
Normative Analysis: Prescribes what ought to be.
Additional info: Most economic research focuses on positive analysis to inform policy.
Three Key Economic Ideas
Assumptions in Economic Analysis
Economic agents interact in markets, and economists make several key assumptions:
People are rational: They use all available information to achieve their goals.
People respond to economic incentives: Changes in incentives alter behavior.
Optimal decisions are made at the margin: Decisions involve comparing marginal benefits and marginal costs.
Marginal Analysis: The process of comparing additional benefits and costs of a decision.
Additional info: Marginal analysis is central to microeconomic theory.
Microeconomics vs. Macroeconomics
Scope and Focus
Microeconomics studies individual decision-making and market outcomes, while macroeconomics examines the economy as a whole.
Microeconomics: Focuses on households, firms, and specific markets.
Macroeconomics: Deals with aggregate economic variables and overall economic performance.
Additional info: Microeconomics is foundational for understanding market behavior and government policy.
Graphical Analysis in Economics
Plotting Price and Quantity
Graphs are essential tools in economics for illustrating relationships between variables, such as price and quantity.
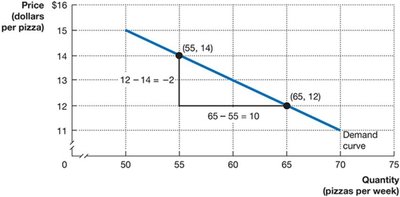
Demand Curve: Shows the relationship between price and quantity demanded.
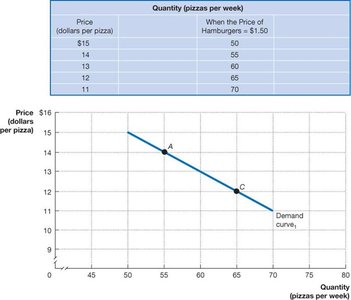
Table Example: Price and quantity combinations for pizza.
Price (dollars per pizza) | Quantity (pizzas per week) | Point |
|---|---|---|
$15 | 50 | A |
14 | 55 | B |
13 | 60 | C |
12 | 65 | D |
11 | 70 | E |
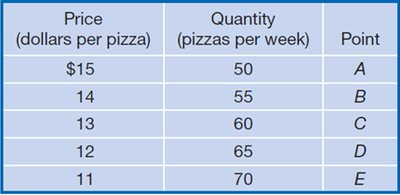

Additional info: The demand curve typically slopes downward, indicating a negative relationship between price and quantity demanded.
Calculating the Slope of a Line
The slope of a line is calculated as the change in the value on the y-axis divided by the change in the value on the x-axis.
Formula:
Example: Between points (55, 14) and (65, 12), slope =
Additional info: A negative slope indicates an inverse relationship between variables.
Relationships Between Variables
Economists are interested in how variables relate to each other. A negative relationship means one variable decreases as the other increases, while a positive relationship means both increase together.
Additional info: Graphs visually demonstrate these relationships, aiding in economic analysis.
The Slope of a Nonlinear Curve
Nonlinear curves have varying slopes at different points. The slope can be approximated over a section or measured using a tangent line at a specific point.
Example: Total cost curve for iPhone production.
Steeper sections: Indicate higher marginal costs.
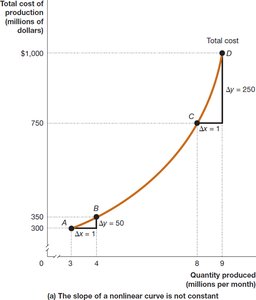
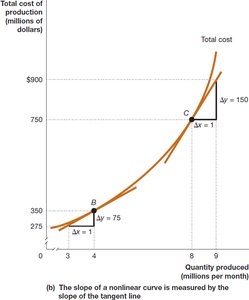
Additional info: Marginal cost is the slope of the total cost curve at a given quantity.
Showing Three Variables on a Graph
Economists often use graphs to show the relationship between three variables, such as price, quantity, and another factor (e.g., price of a substitute).
Demand Curve Shifts: Changes in the price of related goods shift the demand curve.
Example: Increase in hamburger price shifts pizza demand curve right.
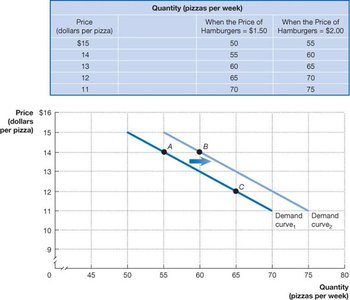
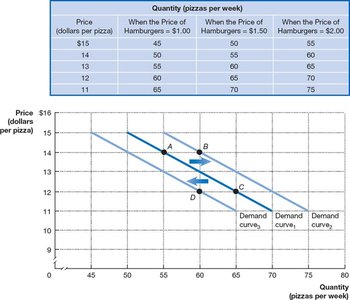
Additional info: Shifts in demand curves reflect changes in consumer preferences or related market conditions.
Area of a Triangle in Economic Graphs
The area of a triangle is often used to calculate economic surplus or other quantities in graphs.
Formula:
Example: If base = 25,000 and height = $0.50, area = $6,250.
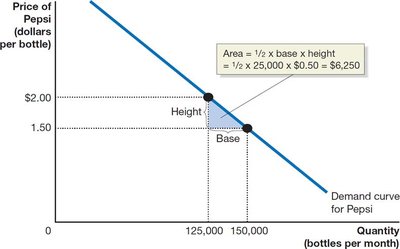
Additional info: This calculation is useful for measuring consumer and producer surplus.
Formula for Percentage Change
Percentage change is a key concept for measuring economic variables over time.
Formula:
Example: U.S. real GDP decreased from \frac{18,426 - 19,092}{19,092} \times 100 = -3.5\%$
Additional info: Percentage change is widely used in economic analysis to track growth, inflation, and other variables.
Equation of a Line
The equation of a line is fundamental in economics for modeling relationships between variables.
Formula:
y: Variable on the y-axis
m: Slope of the line
x: Variable on the x-axis
b: y-intercept
Additional info: This equation is used to represent demand and supply curves, cost functions, and other linear relationships in economics.
