 Back
Household Behavior and Consumer Choice: Principles of Microeconomics Study Guide
Study Guide - Smart Notes
 Tailored notes based on your materials, expanded with key definitions, examples, and context.
Household Behavior and Consumer Choice
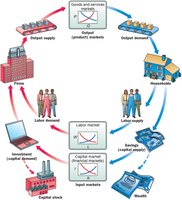
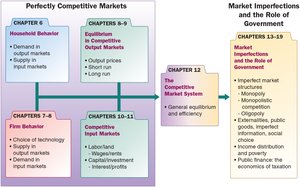
Overview of the Market System
This chapter explores how households make decisions in both output (product) and input (labor/capital) markets, focusing on the principles that govern consumer choice under constraints. The analysis assumes perfect knowledge and perfect competition, where products are homogeneous and no single firm can influence prices.
Perfect Knowledge: Households and firms possess complete information about prices, qualities, wages, and technology.
Perfect Competition: Many small firms produce identical products, ensuring no control over market prices.
Homogeneous Products: Outputs are undifferentiated and indistinguishable from one another.
Household Choice in Output Markets
Households face three fundamental decisions: how much of each product to demand, how much labor to supply, and how much to spend versus save. These choices are constrained by income, wealth, and product prices.
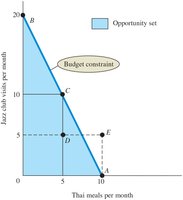
Budget Constraint: The limits imposed on household choices by income, wealth, and product prices.
Choice Set (Opportunity Set): The set of options defined and limited by the budget constraint.
Determinants of Demand: Price of the product, household income, accumulated wealth, prices of other products, tastes and preferences, and expectations about future income, wealth, and prices.
The Budget Constraint: Formal Representation
The budget constraint can be expressed mathematically as:
Equation: Where: = price of good X = quantity of X consumed = price of good Y = quantity of Y consumed = household income
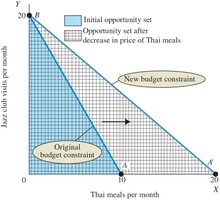
Changes in prices or income alter the opportunity set, expanding or contracting the range of available choices.
The Basis of Choice: Utility
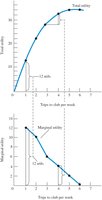
Utility is the satisfaction a product yields. Households allocate their income to maximize total utility, subject to diminishing marginal utility.
Law of Diminishing Marginal Utility: The more of a good consumed, the less additional satisfaction (utility) is gained from each extra unit.
Marginal Utility (MU): The additional satisfaction from consuming one more unit.
Total Utility: The total satisfaction from all units consumed.
Allocating Income to Maximize Utility
Consumers maximize utility by allocating their income so that the marginal utility per dollar spent is equal across all goods. This is known as the utility-maximizing rule.
Utility-Maximizing Rule: Where and are the marginal utilities of goods X and Y, and and are their prices.
Diamond/Water Paradox: Items with high value in use (like water) may have low value in exchange, while items with high value in exchange (like diamonds) may have low value in use.
Diminishing Marginal Utility and Downward-Sloping Demand
The law of diminishing marginal utility explains why demand curves slope downward: as price falls, consumers buy more until the marginal utility of the last unit equals the price.
Income and Substitution Effects
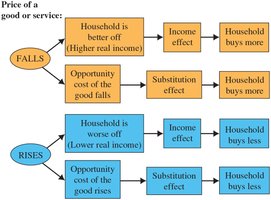
When the price of a good changes, two effects influence household behavior:
Income Effect: A price decrease increases real income, allowing households to buy more.
Substitution Effect: A price decrease makes the good relatively cheaper, causing households to substitute it for other goods.
Household Choice in Input Markets
Households also make decisions about labor supply, influenced by job availability, wage rates, skills, and time constraints. The wage rate is the price of leisure, as choosing leisure means forgoing wages.
Labor Supply Curve: Shows the quantity of labor supplied at different wage rates. Its shape depends on the relative strength of income and substitution effects.
Saving and Borrowing: Present versus Future Consumption
Interest rates affect household saving behavior. Higher interest rates generally increase saving, as the substitution effect outweighs the income effect.
Financial Capital Market: Institutions where households (suppliers of capital) and firms (demanders of capital) interact.
Appendix: Indifference Curves
Indifference curves represent combinations of goods that yield the same total utility. The marginal rate of substitution (MRS) is the rate at which a household is willing to substitute one good for another, and it diminishes as more of one good is consumed.
Indifference Curve: Set of points representing combinations of goods X and Y with equal utility.
Preference Map: A family of indifference curves, with higher curves representing higher utility.
Utility-Maximizing Equilibrium: Occurs where the budget constraint is tangent to the highest possible indifference curve.
Marginal Rate of Substitution (MRS):
Lowering the price of a good swivels the budget constraint, leading to new utility-maximizing combinations and a downward-sloping demand curve.
Key Term | Definition |
|---|---|
Budget Constraint | Limits imposed by income, wealth, and prices |
Marginal Utility | Additional satisfaction from one more unit |
Indifference Curve | Combinations of goods yielding equal utility |
Labor Supply Curve | Quantity of labor supplied at different wages |
Utility-Maximizing Rule | Equalizing marginal utility per dollar across goods |
