 Back
BackLong-Run Costs and Output Decisions in Perfect Competition
Study Guide - Smart Notes
 Tailored notes based on your materials, expanded with key definitions, examples, and context.
Long-Run Costs and Output Decisions
Introduction
This chapter explores how firms make output and cost decisions in the long run, focusing on the differences between short-run and long-run behavior, the concepts of economies and diseconomies of scale, and the mechanisms that drive industry adjustment and equilibrium in perfectly competitive markets.
Short-Run Conditions and Long-Run Directions
Short-Run vs. Long-Run Decisions
Short run: Firms operate with some fixed inputs and cannot freely enter or exit the industry.
Long run: All inputs are variable, and firms can enter or exit the industry as they wish.
Managers must balance immediate constraints with long-term planning.
Short-Run Firm Outcomes
Economic profit: Total revenue (TR) exceeds total cost (TC).
Economic loss (but continue operating): TR covers total variable cost (TVC) but not total fixed cost (TFC).
Shutdown: TR is less than TVC; the firm minimizes losses by ceasing production and bearing losses equal to TFC.
Breaking even: The firm earns exactly a normal rate of return (TR = TC).
Profit Maximization in the Short Run
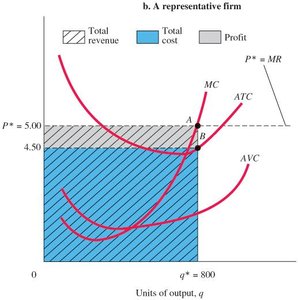
A perfectly competitive firm maximizes profit where price (P) equals marginal cost (MC):
Profit is the difference between total revenue and total cost:
Total cost can be found by multiplying average total cost (ATC) by quantity (q):
Example: At , , , so profit is $400$.
Minimizing Losses and the Shutdown Point
If TR > TVC, the firm should continue operating to cover some fixed costs.
If TR < TVC, the firm should shut down to minimize losses.
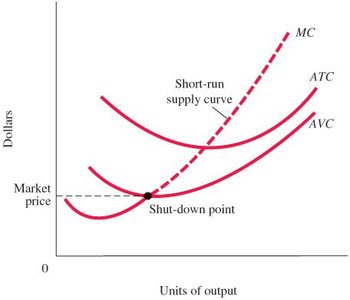
Shutdown point: The lowest point on the AVC curve; below this, the firm cannot cover variable costs.
Short-Run Supply Curve
The short-run supply curve of a perfectly competitive firm is the portion of its MC curve above the AVC curve.
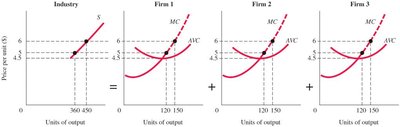
The industry supply curve is the horizontal sum of all firms' MC curves above AVC.
Summary Table: Short-Run and Long-Run Decisions
Short-Run Condition | Short-Run Decision | Long-Run Decision |
|---|---|---|
Profits (TR > TC) | Operate (P = MC) | Expand: new firms enter |
Losses (TR ≥ TVC) | Operate (loss < TFC) | Contract: firms exit |
Losses (TR < TVC) | Shut down (loss = TFC) | Contract: firms exit |
Long-Run Costs: Economies and Diseconomies of Scale
Long-Run Average Cost Curve (LRAC)
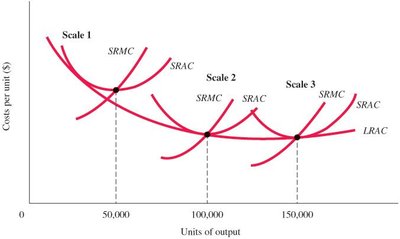
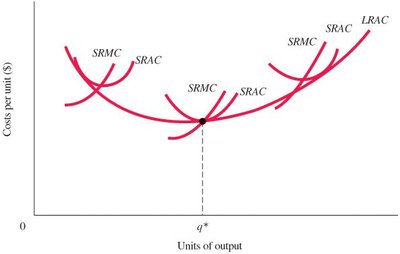
The LRAC shows how per-unit costs change with output when all inputs are variable.
Firms can choose the most efficient scale of operation in the long run.
Types of Returns to Scale
Economies of scale (increasing returns): LRAC decreases as output increases.
Constant returns to scale: LRAC remains unchanged as output increases.
Diseconomies of scale (decreasing returns): LRAC increases as output increases.
Sources of Economies of Scale
Technological advantages, firm-level efficiencies, and bargaining power.
Minimum efficient scale (MES): The smallest output at which LRAC is minimized.
Diseconomies of Scale
Occur when increased size leads to higher per-unit costs, often due to increased bureaucracy or coordination problems.

U-Shaped Long-Run Average Cost Curve
Many firms experience economies of scale at low output, constant returns at intermediate output, and diseconomies at high output.
Optimal scale of plant: The output level that minimizes LRAC.
Long-Run Adjustments to Short-Run Conditions
Industry Response to Demand Changes
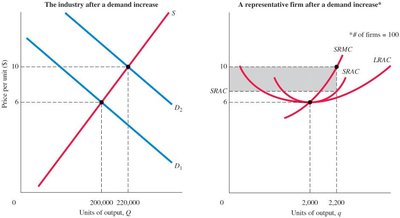
When demand increases, firms earn profits, attracting new entrants and expanding output until profits return to zero.
When demand decreases, firms incur losses, leading to exit and contraction until losses are eliminated.
Long-Run Competitive Equilibrium
In equilibrium, price equals short-run marginal cost (SRMC), short-run average cost (SRAC), and long-run average cost (LRAC):
Firms earn zero economic profit, and supply equals demand.
Appendix: External Economies and Diseconomies & Long-Run Industry Supply Curve
External Economies and Diseconomies
External economies: Industry growth leads to lower LRAC for all firms (decreasing-cost industry).
External diseconomies: Industry growth leads to higher LRAC for all firms (increasing-cost industry).
Long-Run Industry Supply Curve (LRIS)
Decreasing-cost industry: LRIS slopes downward; costs fall as industry expands.
Increasing-cost industry: LRIS slopes upward; costs rise as industry expands.
Constant-cost industry: LRIS is flat; costs do not change as industry expands.
Key Terms and Concepts
Breaking even
Constant returns to scale
Diseconomies of scale
Economies of scale
Long-run average cost curve (LRAC)
Long-run competitive equilibrium
Minimum efficient scale (MES)
Optimal scale of plant
Short-run industry supply curve
Shutdown point
External economies and diseconomies
Long-run industry supply curve (LRIS)
