 Back
BackLecture 1: Market Equilibrium and Predicting Market Changes
Study Guide - Smart Notes
 Tailored notes based on your materials, expanded with key definitions, examples, and context.
Market Equilibrium and Predicting Market Changes
Understanding Markets
Markets are fundamental to microeconomics, serving as the settings where buyers and sellers interact to exchange goods, services, or resources. The concept of a market extends beyond physical locations to include any arrangement that enables trade, including online platforms, auctions, and posted price environments.
Market: Any setting that brings together potential buyers (demanders) and sellers (suppliers).
Examples include consumer goods markets, labor markets, credit markets, and even non-traditional markets such as those for ideas or influence.
Markets can be organized in various ways, such as online listings, auctions, open outcry (e.g., stock exchanges), or posted prices (e.g., retail stores).


What Do Markets Do?
Markets play a central role in organizing economic activity. They determine what gets produced, how much, by whom, and who receives the goods or services. The interaction of supply and demand in markets sets prices and allocates resources efficiently.
Markets bring buyers and sellers together, transforming desires into prices that motivate production.
market sets the price
Market outcomes are determined by the forces of supply and demand.
what does this even mean?
Perfect Competition
Many economic analyses focus on perfectly competitive markets, which are characterized by:
Identical goods
Many buyers and sellers
Each participant is small relative to the overall market (price-takers)
While perfect competition is an idealization, its principles often apply broadly and provide useful intuition for understanding real-world markets.
Market Equilibrium
Definition and Properties
Market equilibrium occurs at the price and quantity where the quantity demanded equals the quantity supplied. At this point, there is no tendency for change, as the forces of supply and demand are balanced.
Equilibrium price: The price at which the market is in equilibrium.
Equilibrium quantity: The quantity bought and sold at the equilibrium price.
At equilibrium, every buyer can find a seller, and every seller can find a buyer.
Graphical Representation
Equilibrium is found at the intersection of the supply and demand curves. At prices above equilibrium, a surplus occurs; at prices below equilibrium, a shortage results.
Surplus: Quantity supplied exceeds quantity demanded (price is too high).
Shortage: Quantity demanded exceeds quantity supplied (price is too low).
Market Adjustment Process
Markets tend to move toward equilibrium through price adjustments:
If there is a shortage, prices rise, increasing quantity supplied and decreasing quantity demanded until equilibrium is restored.
If there is a surplus, prices fall, decreasing quantity supplied and increasing quantity demanded until equilibrium is restored.
Symptoms of Disequilibrium~~
When markets are not in equilibrium, several symptoms may appear:
Long lines (increased effective price due to waiting)
Bundling (retailers add products to increase the effective price)
Secondary markets (reselling at higher prices)


Predicting Market Changes
Three-Step Recipe for Market Analysis
To predict how market outcomes change in response to events, follow these steps:
Determine whether the supply or demand curve (or both) is shifting.
Identify whether the shift is an increase (rightward) or decrease (leftward).
Analyze how the new equilibrium price and quantity will change.
Shifts in Demand
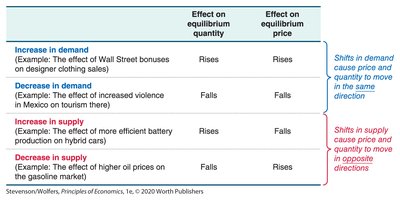
When demand increases (shifts right), both equilibrium price and quantity rise. When demand decreases (shifts left), both equilibrium price and quantity fall.
Example: If cookies become more popular, demand increases, raising both price and quantity.


Shifts in Supply
When supply increases (shifts right), equilibrium price falls and quantity rises. When supply decreases (shifts left), equilibrium price rises and quantity falls.
Example: Improved production technology increases supply, lowering prices and increasing quantity.


Summary Table: Effects of Shifts
| Effect on equilibrium quantity | Effect on equilibrium price |
|---|---|---|
Increase in demand | Rises | Rises |
Decrease in demand | Falls | Falls |
Increase in supply | Rises | Falls |
Decrease in supply | Falls | Rises |

Shifts in Both Supply and Demand
When both curves shift, the outcome depends on the relative size and direction of each shift. Two methods help analyze these cases:
Big-Small Method: The larger shift dominates the outcome.
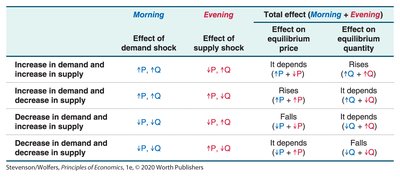
Morning-Evening Method: Analyze each shift sequentially; the total effect is the sum of both shifts.


Summary Table: Combined Shifts
Morning (demand shock) | Evening (supply shock) | Total effect on price | Total effect on quantity | |
|---|---|---|---|---|
Increase in demand and increase in supply | ↑P, ↑Q | ↓P, ↑Q | It depends (↑P + ↓P) | Rises (↑Q + ↑Q) |
Increase in demand and decrease in supply | ↑P, ↑Q | ↑P, ↓Q | Rises (↑P + ↑P) | It depends (↑Q + ↓Q) |
Decrease in demand and increase in supply | ↓P, ↓Q | ↓P, ↑Q | Falls (↓P + ↓P) | It depends (↓Q + ↑Q) |
Decrease in demand and decrease in supply | ↓P, ↓Q | ↑P, ↓Q | It depends (↓P + ↑P) | Falls (↓Q + ↓Q) |
Interpreting Market Data
Market data can reveal which curve has shifted:
If price and quantity move in the same direction, demand has definitely shifted (possibly supply as well).
If price and quantity move in opposite directions, supply has definitely shifted (possibly demand as well).
Example: Market for Cookies
Suppose the market for cookies is in equilibrium at a price of $3 and a quantity of 20. If both price and quantity rise, this indicates an increase in demand. Factors that could increase demand include a decrease in the price of a complement, an increase in the price of a substitute, or a rise in popularity.
Example: Market for Popular Fiction
After the introduction of the Kindle, both the sales and price of popular fiction rose. This suggests an increase in supply (due to lower marginal costs for suppliers), shifting the supply curve to the right.
Key Takeaways
Markets determine what is produced, how, by whom, and who gets it.
Equilibrium occurs when supply equals demand, balancing market forces.
To analyze market changes, identify which curve shifted, the direction of the shift, and the implications for price and quantity.
Market data helps determine whether supply or demand shifted based on the direction of changes in price and quantity.
