 Back
BackMarket Power: Monopoly – Microeconomic Theory Study Notes
Study Guide - Smart Notes
 Tailored notes based on your materials, expanded with key definitions, examples, and context.
Market Power: Monopoly
Introduction to Monopoly
A monopoly is a market structure characterized by a single seller and many buyers. Unlike competitive markets, monopolies have significant control over the price of their product due to the absence of direct competition.
Monopoly: One seller, many buyers.
Competitive Market: Many sellers, many buyers; firms are price takers.
In a monopoly, the firm faces the market demand curve, which is downward sloping.
In a competitive market, the demand curve facing an individual firm is perfectly elastic (horizontal).
Key Point: The monopolist's marginal revenue (MR) is always below the price because increasing output requires lowering the price on all units sold.
Demand and Marginal Revenue in Monopoly
The monopolist can choose any price-quantity combination along the market demand curve. However, to sell more, the monopolist must lower the price, which reduces revenue from all units sold. This causes marginal revenue to fall below the price.
Inverse Demand Function: Expresses price as a function of quantity, p(q).
Revenue Function: R(q) = p(q) \times q.
Marginal Revenue: The derivative of total revenue with respect to quantity, MR(q) = R'(q).
Example: Calculating Marginal Revenue
Suppose the demand function is Q(p) = 100 - 2p. To find the marginal revenue:
Find the inverse demand:
Revenue:
Marginal Revenue:
Observation: The MR curve has the same price-intercept as the demand curve but twice the slope.
Monopolist’s Output Decision
The monopolist chooses output to maximize profit, considering both short-run and long-run conditions:
Short Run: Produce q^* where and .
Long Run: Produce q^* where and .
If these conditions are not met, the monopolist shuts down.
Graphical Solution to Monopoly Profit Maximization
To find the profit-maximizing output and price graphically:
Find q^* where .
Find p^* by plugging q^* into the demand curve.
Check that (short run) or (long run).
Visualizing Monopoly Profit
The monopolist’s profit is the difference between total revenue and total cost at the profit-maximizing output:
Profit:
Per-unit profit:
Example: Graphical Analysis of Monopoly
The following figure shows the demand, marginal revenue (MR), marginal cost (MC), and average cost (AC) curves for a monopolist. The profit-maximizing output, price, and profit can be determined as follows:
Step 1: Find q^* where (e.g., )
Step 2: Find p^* from the demand curve at (e.g., )
Step 3: Check (e.g., )
Profit:
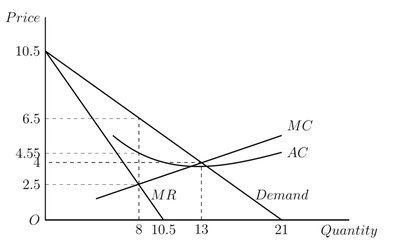
Additional info: The graph visually demonstrates the intersection of MR and MC, the corresponding price from the demand curve, and the calculation of profit as the area between price and average cost at the profit-maximizing quantity.
