 Back
BackMicroeconomic Theory Homework 4 Study Guidance
Study Guide - Smart Notes
 Tailored notes based on your materials, expanded with key definitions, examples, and context.
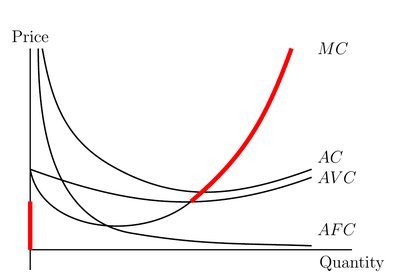
Q2. Refer to the figure below. Notice that the highlighted curve has two disjoint parts. What does the highlighted curve represent?
Background
Topic: Firm Supply Curve in Perfect Competition (Short Run)
This question tests your understanding of how a firm's supply curve is derived in the short run, especially the relationship between marginal cost (MC), average variable cost (AVC), and average total cost (AC).
Key Terms and Formulas:
Marginal Cost (MC): The additional cost of producing one more unit.
Average Variable Cost (AVC): The variable cost per unit of output.
Short-run supply curve: The portion of the MC curve above AVC.
Step-by-Step Guidance
Examine the graph and identify the MC, AVC, AC, and AFC curves. Notice where the MC curve is highlighted.
Recall that in the short run, a firm will only produce if the price is at least as high as the minimum AVC. The supply curve is the MC curve above AVC.
Understand that the vertical segment on the price axis represents the shutdown region (where price is below AVC).
Recognize that the highlighted curve is not the entire MC curve, but only the part above AVC, which is relevant for positive output.
Try solving on your own before revealing the answer!
Final Answer: The highlighted curve represents the portion of the short-run supply curve where the firm produces positive output.
This is the part of the MC curve above AVC, indicating the firm's supply decisions in the short run when price is greater than or equal to AVC.
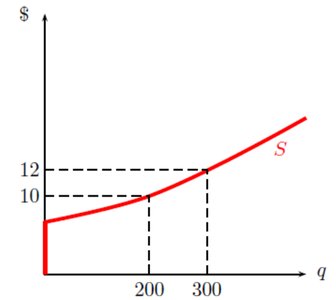
Q11. The following figure shows the supply function of a firm. What is the quantity that maximizes the firm's profits when price is 12?
Background
Topic: Profit Maximization and Supply Function
This question tests your ability to read a supply curve and determine the profit-maximizing output given a market price.
Key Terms and Formulas:
Supply function : Shows the relationship between price and quantity supplied.
Profit maximization: Occurs where price equals marginal cost (for competitive firms).
Step-by-Step Guidance
Locate the price level on the vertical axis of the supply curve.
Draw a horizontal line from to intersect the supply curve .
From the intersection point, drop a vertical line down to the quantity axis to find the corresponding output level.
Compare this output to other possible quantities to ensure it is the profit-maximizing choice at .
Try solving on your own before revealing the answer!
Final Answer: The profit-maximizing quantity is 300 units.
At , the supply curve indicates the firm produces 300 units, maximizing profit at this price.
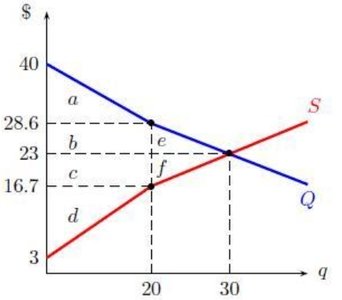
Q16. The following figure shows the demand and supply in a market. When the government imposes a price ceiling of $16.7, what is the size of consumer surplus?
Background
Topic: Price Controls, Consumer Surplus
This question tests your understanding of how price ceilings affect consumer surplus in a market.
Key Terms and Formulas:
Consumer Surplus (CS): The area between the demand curve and the price line, up to the quantity sold.
Price ceiling: A maximum price set by the government, below equilibrium price.

Step-by-Step Guidance
Identify the price ceiling () and the quantity sold (20 units) on the graph.
Locate the area under the demand curve and above the price ceiling, up to 20 units.
Label the relevant regions (a, b, c) as indicated in the graph.
Sum the areas corresponding to consumer surplus at the price ceiling.
Try solving on your own before revealing the answer!
Final Answer: Consumer surplus is a+b+c.
At the price ceiling, consumer surplus is the area under the demand curve and above the price line, up to the quantity sold.
Q17. The following figure shows the demand and supply in a market. When the government imposes a price floor of $28.6, what is the size of producer surplus?
Background
Topic: Price Controls, Producer Surplus
This question tests your understanding of how price floors affect producer surplus in a market.
Key Terms and Formulas:
Producer Surplus (PS): The area above the supply curve and below the price line, up to the quantity sold.
Price floor: A minimum price set by the government, above equilibrium price.

Step-by-Step Guidance
Identify the price floor () and the quantity sold (20 units) on the graph.
Locate the area above the supply curve and below the price floor, up to 20 units.
Label the relevant regions (b, c, d) as indicated in the graph.
Sum the areas corresponding to producer surplus at the price floor.
Try solving on your own before revealing the answer!
Final Answer: Producer surplus is b+c+d.
At the price floor, producer surplus is the area above the supply curve and below the price line, up to the quantity sold.
Q18. The following figure shows the demand and supply in a market. When the government imposes a price floor of $28.6, what is the size of deadweight loss?
Background
Topic: Price Controls, Deadweight Loss
This question tests your understanding of how price floors create deadweight loss in a market.
Key Terms and Formulas:
Deadweight Loss (DWL): The loss of total surplus due to inefficiency, often caused by price controls.
DWL is the area between the supply and demand curves that is not realized due to the price floor.
Step-by-Step Guidance
Identify the efficient output level (where supply and demand intersect) and the actual output level (20 units) under the price floor.
Locate the area between the supply and demand curves from 20 units to the efficient output level.
Label the relevant regions (e, f) as indicated in the graph.
Sum the areas corresponding to deadweight loss at the price floor.
Try solving on your own before revealing the answer!
Final Answer: Deadweight loss is e+f.
At the price floor, deadweight loss is the area between the supply and demand curves from the actual output to the efficient output.
