 Back
BackMicroeconomics: Core Concepts and Applications – Study Notes
Study Guide - Smart Notes
 Tailored notes based on your materials, expanded with key definitions, examples, and context.
Chapter 1: Economic Issues and Concepts
Introduction to Economics
Economics is the study of how scarce resources are allocated to satisfy unlimited human wants. The discipline is divided into microeconomics, which focuses on individual markets and agents, and macroeconomics, which examines the economy as a whole.
Scarcity: Resources are limited, so choices must be made about their use.
Opportunity Cost: The value of the next best alternative forgone when a choice is made.
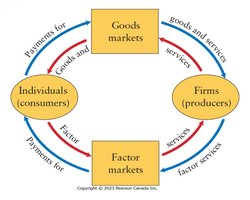
Factors of Production: Land (natural resources), Labour (human effort), and Capital (machinery, equipment).
Production: The process of creating goods and services.
Consumption: The use of goods and services to satisfy wants.
Production Possibilities Boundary (PPB)
The PPB illustrates the trade-offs and opportunity costs associated with allocating resources between different goods.
Negative Slope: Indicates opportunity cost; increasing production of one good requires sacrificing some of another.
Concave Shape: Reflects increasing opportunity costs due to resources not being equally efficient in all uses.
Straight Line: Implies constant opportunity costs.
Key Economic Questions
What is produced and how? Resource allocation and government intervention to correct market failures.
What is consumed and by whom? Distributional fairness and government policies.
Why are resources sometimes idle? Unemployment and government solutions.
Is productive capacity growing? Economic growth and shifts in the PPB.
Self-Organizing Market Economy
Markets coordinate the actions of individuals pursuing their own interests, often leading to efficient outcomes ("the invisible hand"). Incentives and self-interest drive decision-making by consumers, producers, and governments.
Marginal Decisions: Choices are made by comparing additional benefits and costs.
Specialization, Trade, and Money
Specialization: Increases productivity by focusing on specific tasks.
Division of Labour: Breaking production into specialized tasks.
Money: Facilitates trade by eliminating the need for bartering.
Globalization: Increased interconnectedness through trade, technology, and reduced transportation costs.
Types of Economic Systems
Traditional: Based on customs and habits.
Command: Central authority makes economic decisions.
Free-Market: Decentralized decisions coordinated by market prices.
Mixed Economies: Combine elements of all three systems.
Chapter 2: Economic Theories, Data, and Graphs
Positive vs. Normative Statements
Positive Statements: Factual, testable claims about how the world works.
Normative Statements: Value-based, subjective opinions about what ought to be.
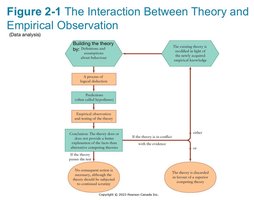
Building and Testing Economic Theories
Economic theories use variables, assumptions, and predictions to explain real-world phenomena. Theories are tested against empirical evidence and revised as needed.
Endogenous Variables: Determined within the theory.
Exogenous Variables: Determined outside the theory.
Scientific Method: Iterative process of theory and evidence.
Statistical Analysis and Data Types
Correlation vs. Causation: Correlation does not imply causation.
Randomized Controlled Trials (RCTs): Used to establish causality.
Index Numbers: Used to compare data across time or groups.

Graphing Economic Theories
Functions: Express relationships between variables, e.g., .
Slope: Measures responsiveness; positive slope for direct relationships, negative for inverse.
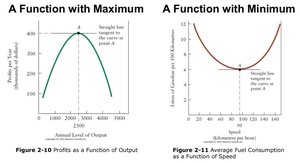
Linear vs. Nonlinear: Linear functions have constant slopes; nonlinear functions have variable slopes.
Maximum/Minimum: At these points, the slope of the curve is zero.
Chapter 3: Demand, Supply, and Price
Demand
Demand refers to the entire relationship between the price of a product and the quantity demanded by consumers.
Law of Demand: As price falls, quantity demanded rises (ceteris paribus).
Demand Schedule: Table showing quantity demanded at various prices.
Demand Curve: Graphical representation of the demand schedule.
Shifts in Demand: Caused by changes in income, prices of related goods (substitutes and complements), preferences, etc.
Supply
Law of Supply: As price rises, quantity supplied increases.
Shifts in Supply: Caused by changes in input prices, technology, number of suppliers, weather, etc.
Market Equilibrium
Equilibrium Price: The price at which quantity demanded equals quantity supplied.
Absolute Price: Price in monetary terms.
Relative Price: Price of one good in terms of another.
Chapter 4: Elasticity
Price Elasticity of Demand
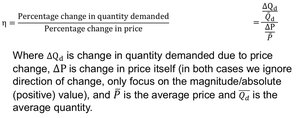
Elasticity measures the responsiveness of quantity demanded or supplied to changes in price or other factors.
Formula:
Interpretation: Elastic (>1), Inelastic (<1), Unit Elastic (=1).
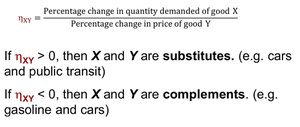
Cross-Price Elasticity of Demand
Measures how the quantity demanded of one good responds to a change in the price of another good.
Formula:
Substitutes:
Complements:
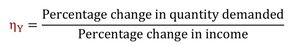
Income Elasticity of Demand
Formula:
Normal Goods: Positive income elasticity.
Inferior Goods: Negative income elasticity.
Chapter 6: Consumer Behaviour
Utility and Consumer Choice
Consumers aim to maximize their total utility (satisfaction) given their budget constraints.
Total Utility: Total satisfaction from consumption.
Marginal Utility: Additional satisfaction from consuming one more unit.
Diminishing Marginal Utility: Each additional unit provides less additional satisfaction.
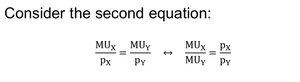
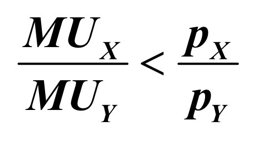
Utility Maximization Condition
Consumers allocate their budget so that the last dollar spent on each good provides the same marginal utility per dollar.
Condition:

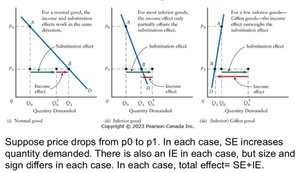
Income and Substitution Effects
A change in the price of a good affects quantity demanded through two channels:
Substitution Effect (SE): Change in consumption due to a change in relative prices, holding real income constant.
Income Effect (IE): Change in consumption due to a change in real income, holding relative prices constant.
Chapter 7: Producers in the Short Run
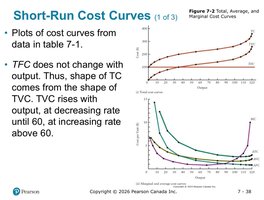
Short-Run Cost Curves
Firms face various types of costs in the short run, where at least one factor of production is fixed.
Total Fixed Cost (TFC): Costs that do not vary with output.
Total Variable Cost (TVC): Costs that vary with output.
Total Cost (TC):
Average Total Cost (ATC):
Average Variable Cost (AVC):
Average Fixed Cost (AFC):
Marginal Cost (MC): The increase in total cost from producing one more unit.
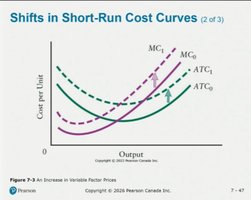
Shifts in Short-Run Cost Curves
Changes in input prices can shift cost curves. An increase in variable factor prices shifts both MC and ATC upward.
Additional info:
These notes cover the foundational chapters of a college-level microeconomics course, including economic concepts, theories, demand and supply, elasticity, consumer behaviour, and cost structures.
All equations are provided in LaTeX format for clarity and academic rigor.
Images included are directly relevant to the explanation of the adjacent paragraphs and reinforce key concepts.
