 Back
BackMicroeconomics: Core Concepts, Market Structures, and Policy Interventions
Study Guide - Smart Notes
 Tailored notes based on your materials, expanded with key definitions, examples, and context.
Demand, Supply, and Market Equilibrium
Basic Principles of Demand and Supply
The interaction of demand and supply determines the equilibrium price and quantity in a market. Shifts in either curve can result from changes in external factors, leading to new equilibrium outcomes.
Demand Curve: Shows the relationship between price and quantity demanded, holding other factors constant. Typically downward sloping due to the law of demand.
Supply Curve: Shows the relationship between price and quantity supplied, holding other factors constant. Typically upward sloping due to the law of supply.
Equilibrium: The point where the demand and supply curves intersect, determining the market price and quantity.
Shifts: Changes in income, tastes, prices of related goods, or expectations can shift demand; changes in input prices, technology, or number of sellers can shift supply.
Surplus: Occurs when quantity supplied exceeds quantity demanded at a given price, leading to downward pressure on price.
Shortage: Occurs when quantity demanded exceeds quantity supplied at a given price, leading to upward pressure on price.
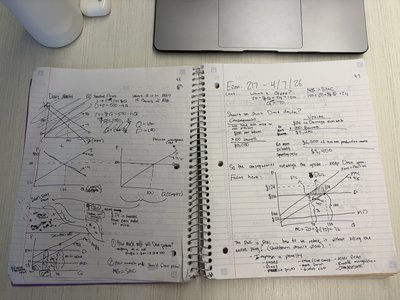
Consumer and Producer Surplus
Measuring Market Welfare
Consumer and producer surplus are key measures of economic welfare in a market. They represent the net benefits to buyers and sellers from participating in the market.
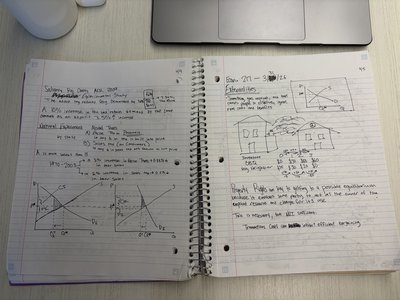
Consumer Surplus (CS): The difference between what consumers are willing to pay and what they actually pay. Graphically, it is the area below the demand curve and above the market price.
Producer Surplus (PS): The difference between the price sellers receive and their minimum acceptable price. Graphically, it is the area above the supply curve and below the market price.
Total Surplus: The sum of consumer and producer surplus, representing total net benefits to society from market transactions.
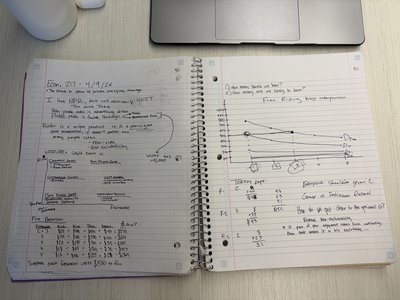
Elasticity
Price Elasticity of Demand and Supply
Elasticity measures the responsiveness of quantity demanded or supplied to changes in price or other factors. It is crucial for understanding market dynamics and the effects of policy interventions.
Price Elasticity of Demand (PED): Measures the percentage change in quantity demanded resulting from a 1% change in price.
Formula:
Elastic Demand: PED > 1 (quantity demanded is responsive to price changes).
Inelastic Demand: PED < 1 (quantity demanded is not very responsive to price changes).
Unit Elastic: PED = 1.
Price Elasticity of Supply (PES): Measures the responsiveness of quantity supplied to a change in price.
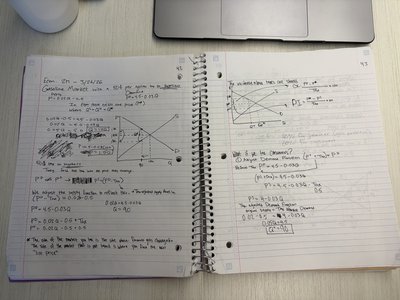
Government Intervention: Price Controls and Taxes
Price Ceilings, Price Floors, and Taxes
Governments may intervene in markets through price controls or taxes, which can lead to inefficiencies such as shortages, surpluses, and deadweight loss.
Price Ceiling: A legal maximum price (e.g., rent control). If set below equilibrium, it causes shortages.
Price Floor: A legal minimum price (e.g., minimum wage). If set above equilibrium, it causes surpluses.
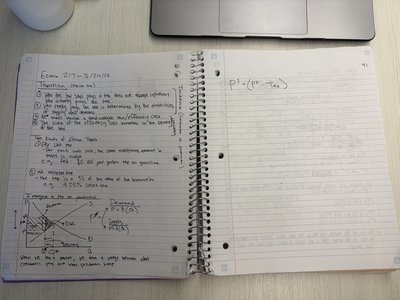
Tax Incidence: The division of the tax burden between buyers and sellers depends on the relative elasticities of demand and supply.
Deadweight Loss: The reduction in total surplus resulting from a market distortion such as a tax or price control.
Tax Formula: (where is the price paid by buyers, is the price received by sellers)
Externalities and Market Failure
Negative and Positive Externalities
Externalities occur when the actions of individuals or firms have effects on third parties that are not reflected in market prices, leading to market failure.
Negative Externality: A cost imposed on others (e.g., pollution). The market equilibrium quantity is higher than the socially optimal quantity.
Positive Externality: A benefit conferred on others (e.g., education). The market equilibrium quantity is lower than the socially optimal quantity.
Social Cost: The total cost to society, including both private and external costs.
Corrective Taxes/Subsidies: Policies to align private incentives with social optimum.
Production, Costs, and Firm Behavior
Short-Run and Long-Run Costs
Firms face different cost structures in the short run and long run, influencing their production decisions and market supply.
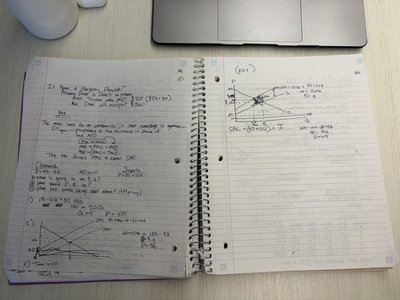
Short-Run Costs: Some inputs are fixed. Includes fixed costs (FC), variable costs (VC), total costs (TC), average costs (AC), and marginal cost (MC).
Long-Run Costs: All inputs are variable. Firms can adjust all factors of production.
Cost Curves: Graphical representations of cost relationships. Marginal cost intersects average total cost at its minimum.
Economies of Scale: Long-run average cost decreases as output increases.
Diseconomies of Scale: Long-run average cost increases as output increases.
Market Structures: Perfect Competition
Characteristics and Outcomes
Perfect competition is a market structure characterized by many buyers and sellers, homogeneous products, and free entry and exit. Firms are price takers and maximize profit where marginal cost equals marginal revenue.
Profit Maximization:
Short-Run Equilibrium: Firms may earn profits or losses.
Long-Run Equilibrium: Entry and exit drive economic profit to zero.
Efficiency: Perfectly competitive markets achieve allocative and productive efficiency.
Monopoly and Market Power
Monopoly Pricing and Welfare Effects
A monopoly is a market with a single seller and significant barriers to entry. Monopolists set prices above marginal cost, leading to reduced output and deadweight loss compared to perfect competition.
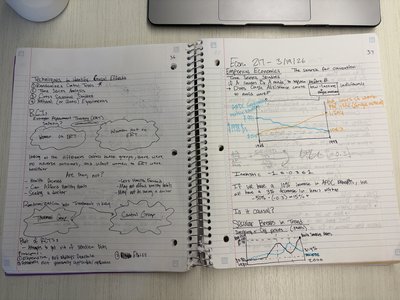
Monopoly Pricing: Monopolists maximize profit where , but price is set above marginal cost.
Deadweight Loss: The loss of total surplus due to monopoly pricing.
Price Discrimination: Charging different prices to different consumers based on willingness to pay.
Game Theory and Strategic Behavior
Basic Concepts in Game Theory
Game theory analyzes strategic interactions where the outcome for each participant depends on the actions of others. It is especially relevant in oligopoly and monopolistic competition.
Nash Equilibrium: A situation where no player can improve their payoff by unilaterally changing their strategy.
Dominant Strategy: A strategy that is best for a player regardless of the strategies chosen by others.
Prisoner's Dilemma: A classic example illustrating why individuals may not cooperate even when it is in their best interest.
Summary Table: Key Microeconomic Concepts
Concept | Definition | Key Formula |
|---|---|---|
Elasticity | Responsiveness of quantity to price changes | |
Consumer Surplus | Benefit to buyers over what they pay | Area under demand, above price |
Producer Surplus | Benefit to sellers over cost | Area above supply, below price |
Deadweight Loss | Loss of total surplus from inefficiency | Area between supply and demand not realized |
Profit Maximization | Optimal output for firms |
