 Back
BackMicroeconomics Core Concepts: Principles, Models, and Market Analysis
Study Guide - Smart Notes
 Tailored notes based on your materials, expanded with key definitions, examples, and context.
Basic Principles of Economics
Scarcity and Choice
Economics is the study of how people, groups, and societies allocate scarce resources to satisfy unlimited wants. Scarcity means that resources are limited, so choices must be made about their use.
Scarcity: The condition where resources are insufficient to satisfy all human wants.
Choice: The act of selecting among alternatives due to scarcity.
Opportunity Cost: The value of the next best alternative forgone when a choice is made.
Trade-offs: All alternatives that must be given up when making a decision.
Marginal Analysis: Examining the additional benefits of an activity compared to the additional costs incurred by that same activity.
Example: Choosing to attend college involves the opportunity cost of foregone earnings from working full-time.
Types of Resources
Resources, also known as factors of production, are inputs used to produce goods and services.
Land: Natural resources used in production.
Labor: Human effort used in production.
Capital: Manufactured goods used to produce other goods and services (e.g., machines, tools).
Entrepreneurship: The ability to combine land, labor, and capital to create new goods and services.
Reading and Understanding Graphs
Graphical Representation in Economics
Graphs are essential tools in economics for visualizing relationships between variables, such as price and quantity.
Axes: The vertical axis (y-axis) typically represents price, while the horizontal axis (x-axis) represents quantity.
Curves: Demand and supply curves show the relationship between price and quantity demanded or supplied.
Introductory Economic Models
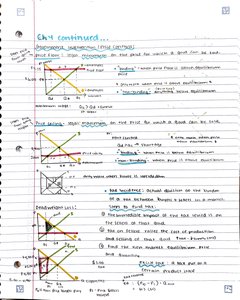
Production Possibilities Frontier (PPF)
The PPF is a model that shows the maximum possible output combinations of two goods that can be produced with available resources and technology.
Efficient Points: Points on the PPF represent efficient production levels.
Inefficient Points: Points inside the PPF indicate underutilization of resources.
Unattainable Points: Points outside the PPF are not possible given current resources.
Opportunity Cost: The slope of the PPF shows the opportunity cost of one good in terms of the other.
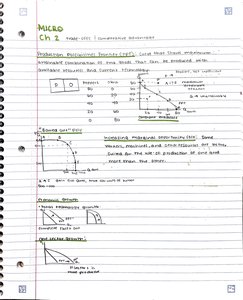
Shifts in the PPF
The PPF can shift outward with economic growth, technological advancement, or an increase in resources.
Economic Growth: Results in an outward shift of the PPF, allowing more of both goods to be produced.
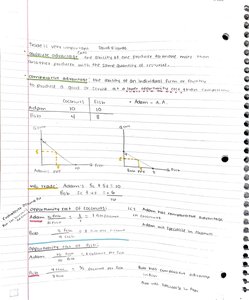
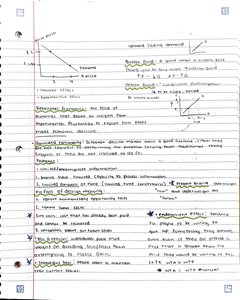
Comparative and Absolute Advantage
Comparative advantage refers to the ability to produce a good at a lower opportunity cost than another producer, while absolute advantage is the ability to produce more of a good with the same resources.
Comparative Advantage: Basis for trade between individuals or nations.
Absolute Advantage: Producing more output with the same input.
The Market Forces of Supply and Demand
Demand
Demand is the quantity of a good or service that consumers are willing and able to purchase at various prices during a given period.
Law of Demand: As price decreases, quantity demanded increases, ceteris paribus (all else equal).
Determinants of Demand: Income, tastes and preferences, prices of related goods (substitutes and complements), expectations, and number of buyers.
Demand Curve: Downward sloping, showing inverse relationship between price and quantity demanded.
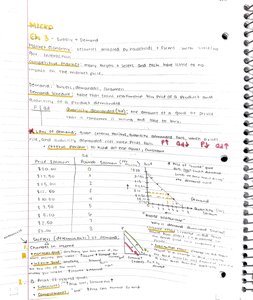
Supply
Supply is the quantity of a good or service that producers are willing and able to sell at various prices during a given period.
Law of Supply: As price increases, quantity supplied increases, ceteris paribus.
Determinants of Supply: Input prices, technology, expectations, number of sellers, and prices of related goods.
Supply Curve: Upward sloping, showing direct relationship between price and quantity supplied.
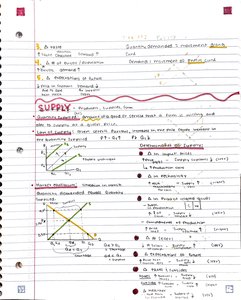
Market Equilibrium
Market equilibrium occurs where the quantity demanded equals the quantity supplied at a particular price.
Equilibrium Price: The price at which quantity demanded equals quantity supplied.
Equilibrium Quantity: The quantity bought and sold at the equilibrium price.
Surplus: Occurs when quantity supplied exceeds quantity demanded at a given price.
Shortage: Occurs when quantity demanded exceeds quantity supplied at a given price.
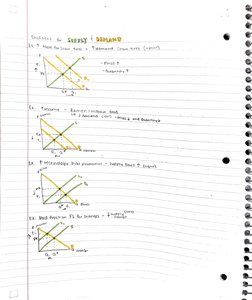
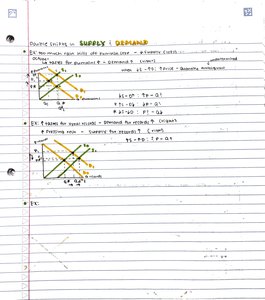
Shifts in Supply and Demand
Changes in determinants other than price cause the supply or demand curve to shift, leading to a new equilibrium.
Increase in Demand: Shifts the demand curve right, raising equilibrium price and quantity.
Decrease in Demand: Shifts the demand curve left, lowering equilibrium price and quantity.
Increase in Supply: Shifts the supply curve right, lowering equilibrium price and raising equilibrium quantity.
Decrease in Supply: Shifts the supply curve left, raising equilibrium price and lowering equilibrium quantity.
Elasticity
Price Elasticity of Demand
Price elasticity of demand measures the responsiveness of quantity demanded to a change in price.
Formula:
Elastic Demand: (quantity demanded is very responsive to price changes)
Inelastic Demand: (quantity demanded is not very responsive to price changes)
Unit Elastic:
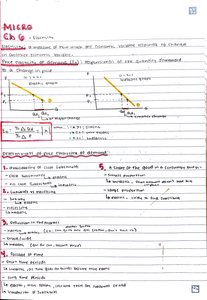
Determinants of Elasticity
Availability of substitutes
Necessity vs. luxury
Proportion of income spent on the good
Time horizon
Other Elasticities
Income Elasticity of Demand: Measures how quantity demanded changes as consumer income changes.
Cross-Price Elasticity of Demand: Measures how quantity demanded of one good changes as the price of another good changes.
Consumer and Producer Surplus; Price Ceilings and Floors
Consumer Surplus
Consumer surplus is the difference between what consumers are willing to pay for a good and what they actually pay.
Graphically: Area below the demand curve and above the market price.
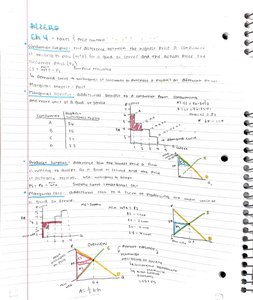
Producer Surplus
Producer surplus is the difference between the price sellers receive for a good and the minimum price they are willing to accept.
Graphically: Area above the supply curve and below the market price.
Price Ceilings and Price Floors
Price controls are government-imposed limits on how high or low a price can be charged for a product.
Price Ceiling: Maximum legal price (e.g., rent control). Can cause shortages.
Price Floor: Minimum legal price (e.g., minimum wage). Can cause surpluses.
The Costs of Production
Short-Run and Long-Run Costs
Costs of production are categorized into fixed and variable costs, which together make up total cost.
Fixed Costs (FC): Costs that do not vary with output (e.g., rent).
Variable Costs (VC): Costs that change with the level of output (e.g., materials).
Total Cost (TC):
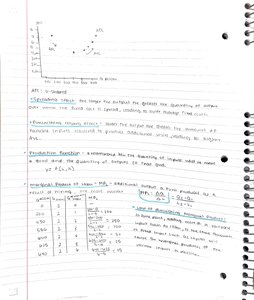
Average Total Cost (ATC):
Marginal Cost (MC):
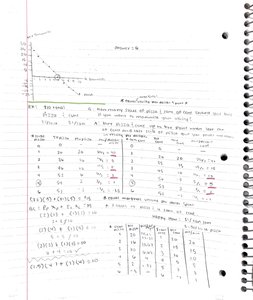
Production Function and Marginal Product
The production function shows the relationship between inputs and output. Marginal product is the additional output from using one more unit of input.
Law of Diminishing Returns: As more units of a variable input are added to fixed inputs, the additional output from each new unit will eventually decrease.
Perfect Competition
Characteristics of Perfect Competition
Perfect competition is a market structure characterized by many buyers and sellers, identical products, and free entry and exit.
Firms are price takers.
There is perfect information.
Firms can freely enter or exit the market.
Profit Maximization in Perfect Competition
Firms maximize profit where marginal cost equals marginal revenue ().
Short-Run: Firms may earn positive, zero, or negative economic profit.
Long-Run: Firms earn zero economic profit due to entry and exit.
Monopoly
Characteristics of Monopoly
A monopoly is a market with a single seller of a unique product with no close substitutes and high barriers to entry.
Monopolists are price makers.
Profit maximization occurs where , but price is set above marginal cost.
Monopolistic Competition
Characteristics of Monopolistic Competition
Monopolistic competition is a market structure with many firms selling differentiated products and free entry and exit.
Firms have some control over price due to product differentiation.
In the long run, firms earn zero economic profit.
Oligopoly
Characteristics of Oligopoly
An oligopoly is a market structure with a few large firms that dominate the market. Firms may collude or compete.
Firms are interdependent.
Outcomes depend on strategic interactions (game theory).
Markets for the Factors of Production
Factor Markets
Markets for the factors of production (land, labor, capital) determine the income of households and the costs for firms.
Wages, rent, and interest are determined by supply and demand in factor markets.
Income Inequality and Poverty
Measuring Inequality
Income inequality is measured using tools such as the Lorenz curve and Gini coefficient.
Lorenz Curve: Graphical representation of income distribution.
Gini Coefficient: Numerical measure of inequality (0 = perfect equality, 1 = perfect inequality).
Consumer Choice and Behavioral Economics
Utility Maximization
Consumers make choices to maximize their utility (satisfaction) given their budget constraints.
Budget Constraint: The limit on the consumption bundles that a consumer can afford.
Indifference Curve: Shows combinations of goods that provide the same level of utility.
Behavioral Economics
Behavioral economics studies how psychological factors affect economic decision-making.
People may not always act rationally due to biases and heuristics.
Additional info: Some sections have been expanded for clarity and completeness based on standard microeconomics curriculum.
