 Back
Microeconomics Cost and Production Analysis Study Guide
Study Guide - Smart Notes
 Tailored notes based on your materials, expanded with key definitions, examples, and context.
Q1. Derive the cost equations for a firm with production function , given labor price , capital price , and fixed capital in the short run.
Background
Topic: Cost Structure and Production Functions
This question tests your understanding of how a firm's production function determines its cost structure, especially in the short run when one input (capital) is fixed.
Key Terms and Formulas
Production function:
Short-run: Capital () is fixed at
Cost equation:
Fixed cost (FC): Cost associated with fixed input ()
Variable cost (VC): Cost associated with variable input ()
Step-by-Step Guidance
Start by substituting the fixed value of into the production function: .
Simplify the production function to express in terms of : .
Write the total cost equation using , substituting , , and .
Express in terms of by substituting into the cost equation.
Set up formulas for fixed cost () and variable cost () using the cost equation.
Try solving on your own before revealing the answer!
Final Answer:
Total cost equation:
Fixed cost:
Variable cost:
These formulas allow you to calculate total, fixed, and variable costs for any output in the short run.
Q2. Using the cost equations from Q1, fill out the table for to with columns for , , , , , , and .
Background
Topic: Cost Table Construction
This question tests your ability to apply cost formulas to calculate various cost measures for different output levels.
Key Terms and Formulas
Total cost ():
Fixed cost ():
Variable cost ():
Marginal cost ():
Average fixed cost ():
Average variable cost ():
Average cost ():
Step-by-Step Guidance
For each from $0, use the formulas above to calculate , , and .
Calculate by finding the change in as increases by 1 unit.
Compute , , and for each (except , where division by zero is undefined).
Fill in the table with these values, showing your calculations for each step.
Try solving on your own before revealing the answer!
Final Answer:
Sample table for to :
Q | C | F | VC | MC | AFC | AVC | AC |
|---|---|---|---|---|---|---|---|
0 | 50 | 50 | 0 | - | - | - | - |
1 | 50.02 | 50 | 0.02 | 0.02 | 50 | 0.02 | 50.02 |
2 | 50.04 | 50 | 0.04 | 0.02 | 25 | 0.02 | 25.02 |
3 | 50.06 | 50 | 0.06 | 0.02 | 16.67 | 0.02 | 16.69 |
4 | 50.08 | 50 | 0.08 | 0.02 | 12.5 | 0.02 | 12.52 |
5 | 50.10 | 50 | 0.10 | 0.02 | 10 | 0.02 | 10.02 |
Each value is calculated using the formulas from Q1. Marginal cost is constant because the variable cost increases linearly with .
Q2. (a) What is the slope of an Isocost line if and ?
Background
Topic: Isocost Lines
This question tests your understanding of how input prices determine the slope of an isocost line, which represents combinations of labor and capital that cost the same.
Key Terms and Formulas
Isocost line equation:
Slope of isocost line:
Step-by-Step Guidance
Write the isocost equation: .
Rearrange to solve for in terms of : .
Identify the slope as .
Substitute and into the slope formula.
Try solving on your own before revealing the answer!
Final Answer:
Slope of the isocost line:
This means for every additional unit of labor, capital must decrease by 2 units to keep total cost constant.
Q2. (b) Draw two Isocost lines for and using .
Background
Topic: Isocost Line Visualization
This question tests your ability to graphically represent isocost lines for different total costs.
Key Terms and Formulas
Isocost line equation:
Step-by-Step Guidance
For , write the equation: .
For , write the equation: .
Plot both lines on a graph with on the x-axis and on the y-axis.
Label each line according to its total cost.
Try solving on your own before revealing the answer!
Final Answer:
Isocost lines:
:
:
Each line shows the combinations of and that cost $100, respectively.
Q3. (a) Draw a diagram showing the least-cost combination of and for producing output using an Isoquant and an Isocost curve.
Background
Topic: Isoquants and Isocosts
This question tests your ability to use graphical analysis to find the least-cost input combination for a given output.
Key Terms and Formulas
Isoquant: Curve showing all input combinations that produce a given output
Isocost: Line showing all input combinations with the same total cost
Least-cost combination: Point where the isoquant is tangent to the isocost line
Step-by-Step Guidance
Draw an isoquant for output on a graph with and axes.
Draw an isocost line for a given total cost.
Identify the point of tangency between the isoquant and isocost line.
This point represents the least-cost combination of and for producing .
Try solving on your own before revealing the answer!
Final Answer:
The least-cost combination is found at the tangency point between the isoquant for and the isocost line. At this point, the slopes of the isoquant and isocost are equal: .
Q3. (b) If the price of capital () increases, what happens to the least-cost combination of and for producing ?
Background
Topic: Input Price Changes and Cost Minimization
This question tests your intuition about how changes in input prices affect the firm's choice of input combinations.
Key Terms and Formulas
Isocost slope:
Least-cost combination: Point of tangency between isoquant and isocost
Step-by-Step Guidance
Consider how an increase in affects the slope of the isocost line.
The isocost line becomes steeper, meaning capital becomes relatively more expensive.
The firm will substitute away from capital toward labor, changing the least-cost combination.
Expect the new combination to use more labor and less capital for the same output .
Try solving on your own before revealing the answer!
Final Answer:
When increases, the isocost line becomes steeper. The least-cost combination shifts to use more labor and less capital, as capital is now relatively more expensive.
Q3. (c) Draw a second isocost line to show the new least-cost combination after the price of capital increases.
Background
Topic: Graphical Analysis of Input Price Changes
This question tests your ability to visually represent the effect of input price changes on the firm's cost-minimizing choices.
Key Terms and Formulas
Isocost line:
Isoquant: Curve for output
Step-by-Step Guidance
Draw the original isocost line and isoquant for .
Draw a new isocost line with a steeper slope, reflecting the higher price of capital.
Identify the new tangency point, which shows the new least-cost combination.
Label the new isocost line and the new input combination.
Try solving on your own before revealing the answer!
Final Answer:
The new isocost line is steeper, and the new least-cost combination is at a point with more labor and less capital. This visually demonstrates the substitution effect due to the increase in .
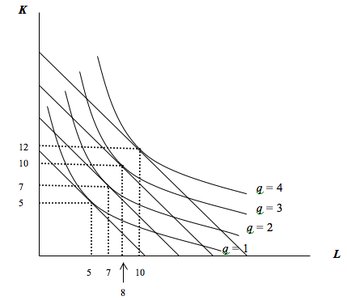
Q4. Using the diagram below, fill out a table for to with columns for total cost (), marginal cost (), and average cost (), given and .
Background
Topic: Long-Run Cost Calculation
This question tests your ability to use graphical information to calculate cost measures for different output levels in the long run.
Key Terms and Formulas
Total cost ():
Marginal cost ():
Average cost ():
Step-by-Step Guidance
For each (from 0 to 4), use the diagram to find the corresponding values of and .
Calculate total cost for each using .
Compute marginal cost as the change in total cost when increases by 1.
Calculate average cost for each (except ).
Fill in the table with these values, showing your calculations for each step.
Try solving on your own before revealing the answer!
Final Answer:
Sample table (using diagram values):
Q | C | MC | AC |
|---|---|---|---|
0 | 0 | - | - |
1 | 100 | 100 | 100 |
2 | 140 | 40 | 70 |
3 | 170 | 30 | 56.67 |
4 | 200 | 30 | 50 |
Values are calculated using , , and the and values from the diagram for each .
Q5. End of chapter question #3.6 from Chapter 7 of Perloff.
Background
Topic: Application of Cost and Production Concepts
This question is likely testing your ability to apply cost and production concepts to a specific scenario or problem from the textbook.
Key Terms and Formulas
Refer to the textbook for the exact question and relevant formulas.
Step-by-Step Guidance
Read the textbook question carefully and identify what is being asked.
Determine which cost or production formulas are relevant to the problem.
Set up the equations and solve step-by-step, stopping before the final calculation.
Try solving on your own before revealing the answer!
Final Answer:
Refer to Chapter 7, question 3.6 in Perloff for the full solution. Apply the relevant cost and production formulas as discussed above.
