 Back
BackMicroeconomics: Cost Curves, Market Structures, and Competitive Markets – Study Guide with Visuals
Study Guide - Smart Notes
 Tailored notes based on your materials, expanded with key definitions, examples, and context.
Q1. What are the key cost formulas used in microeconomics for analyzing firm behavior?
Background
Topic: Cost Concepts in Microeconomics
This question focuses on the fundamental cost formulas that firms use to analyze their production decisions in both the short run and long run. Understanding these formulas is essential for calculating total, average, and marginal costs, which are critical for profit maximization and cost minimization strategies.
Key Terms and Formulas:
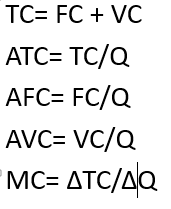
Total Cost (TC):
Average Total Cost (ATC):
Average Fixed Cost (AFC):
Average Variable Cost (AVC):
Marginal Cost (MC):
Step-by-Step Guidance
Identify the fixed costs (FC) and variable costs (VC) for the firm. Fixed costs do not change with output, while variable costs do.
Calculate total cost (TC) by adding FC and VC: .
Determine the quantity of output produced (Q). Use this to calculate average costs:
Average Total Cost:
Average Fixed Cost:
Average Variable Cost:
To find marginal cost (MC), calculate the change in total cost () when output increases by one unit (): .
Set up the formulas with your specific values for FC, VC, and Q to practice calculating each cost measure.
Try solving on your own before revealing the answer!
Final Answer:
The key cost formulas are:
These formulas allow you to analyze how costs behave as output changes, which is crucial for making production and pricing decisions in microeconomics.
Q2. Identify and interpret the short-run cost curves on a graph.
Background
Topic: Short-Run Cost Curves
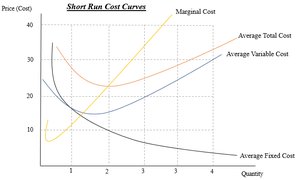
This question tests your ability to recognize and interpret the Marginal Cost (MC), Average Total Cost (ATC), Average Variable Cost (AVC), and Average Fixed Cost (AFC) curves on a graph. Understanding the shape and relationships of these curves is essential for analyzing firm behavior in the short run.
Key Terms and Formulas:
Marginal Cost (MC): The additional cost of producing one more unit of output.
Average Total Cost (ATC): Total cost per unit of output.
Average Variable Cost (AVC): Variable cost per unit of output.
Average Fixed Cost (AFC): Fixed cost per unit of output.
Step-by-Step Guidance
Locate the MC curve. It typically has a "U" shape and intersects both the ATC and AVC curves at their minimum points.
Identify the ATC curve, which is always above the AVC curve and also has a "U" shape due to spreading fixed costs and diminishing returns.
Find the AVC curve, which lies below the ATC curve and also has a "U" shape, but does not include fixed costs.
Observe the AFC curve, which continuously declines as output increases, since fixed costs are spread over more units.
Practice labeling each curve and noting where MC intersects ATC and AVC at their lowest points.
Try solving on your own before revealing the answer!
Final Answer:
On the short-run cost curves graph:
The MC curve intersects the ATC and AVC curves at their minimum points.
The ATC curve is above the AVC curve, and both are "U" shaped.
The AFC curve declines continuously as output increases.
Recognizing these relationships helps you analyze cost behavior and firm decisions in the short run.
