 Back
BackMicroeconomics: Demand, Supply, and Market Equilibrium
Study Guide - Smart Notes
 Tailored notes based on your materials, expanded with key definitions, examples, and context.
Demand and Supply in Competitive Markets
Introduction to Markets and Prices
A market is any arrangement that enables buyers and sellers to obtain information and conduct business. In a competitive market, there are many buyers and sellers, so no single participant can influence the price. The money price is the amount of money required to purchase a good, while the relative price is the ratio of the money price of one good to another, representing its opportunity cost.
Demand
Definition and Law of Demand
Demand refers to the relationship between the price of a good and the quantity consumers are willing and able to buy at each price. The law of demand states: Other things remaining the same, the higher the price of a good, the smaller the quantity demanded; the lower the price, the larger the quantity demanded. This relationship is explained by:
Substitution effect: As the price of a good rises, consumers switch to substitutes, reducing quantity demanded.
Income effect: A higher price reduces consumers' purchasing power, decreasing quantity demanded.
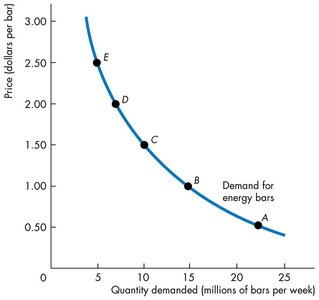
Demand Curve and Demand Schedule
The demand curve graphically shows the relationship between price and quantity demanded, holding other factors constant. The demand schedule is a table listing quantities demanded at various prices.
Willingness and Ability to Pay
The demand curve also represents consumers' willingness and ability to pay for each additional unit, reflecting the marginal benefit of consumption.
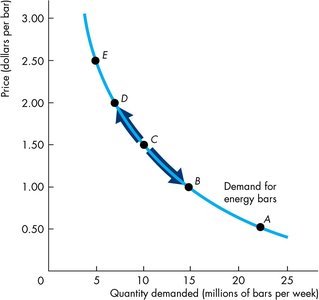
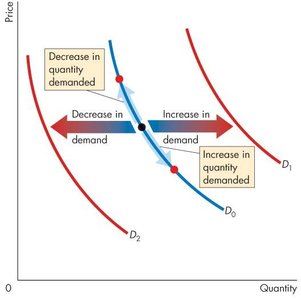
Changes in Demand vs. Changes in Quantity Demanded
A change in demand means the entire demand curve shifts due to factors other than the good's price. A change in quantity demanded is a movement along the demand curve caused by a price change.
Determinants of Demand
Seven main factors can shift the demand curve:
Prices of related goods: Substitutes (goods used in place of each other) and complements (goods used together).
Expected future prices: If prices are expected to rise, current demand increases.
Income: Higher income increases demand for normal goods and decreases demand for inferior goods.
Taxes and subsidies
Expected future income and credit
Population: Larger population increases demand.
Preferences: Changes in tastes and preferences affect demand.
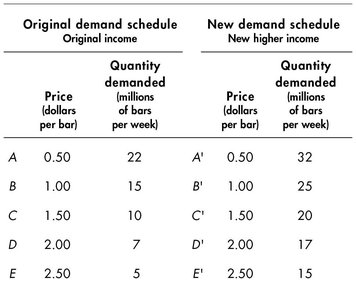
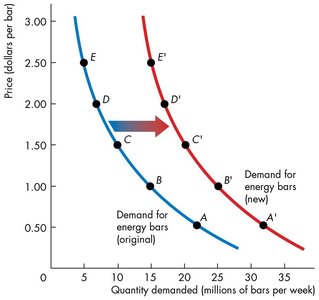
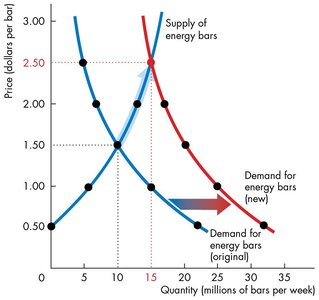
Example: Income and Demand
When income rises, the demand for normal goods increases, shifting the demand curve rightward. The table below compares the original and new demand schedules for energy bars after an increase in income:
Price (dollars per bar) | Quantity demanded (original) | Price (dollars per bar) | Quantity demanded (new income) |
|---|---|---|---|
0.50 | 22 | 0.50 | 32 |
1.00 | 15 | 1.00 | 25 |
1.50 | 10 | 1.50 | 20 |
2.00 | 7 | 2.00 | 17 |
2.50 | 5 | 2.50 | 15 |
Supply
Definition and Law of Supply
Supply is the relationship between the price of a good and the quantity producers are willing and able to sell at each price. The law of supply states: Other things remaining the same, the higher the price of a good, the greater the quantity supplied; the lower the price, the smaller the quantity supplied. This is due to increasing marginal cost as output rises.
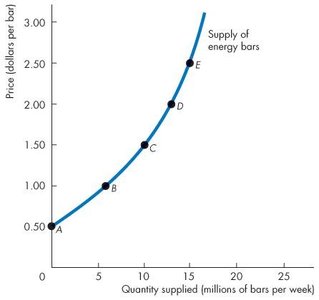
Supply Curve and Supply Schedule
The supply curve shows the relationship between price and quantity supplied, holding other factors constant. The supply schedule is a table listing quantities supplied at various prices.
Minimum Supply Price and Marginal Cost
The supply curve also represents the minimum price at which producers are willing to sell each unit, which equals the marginal cost of production.
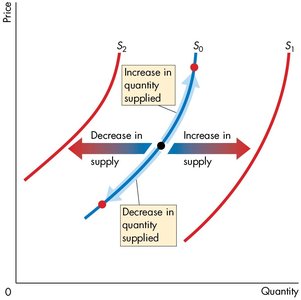
Changes in Supply vs. Changes in Quantity Supplied
A change in supply means the entire supply curve shifts due to factors other than the good's price. A change in quantity supplied is a movement along the supply curve caused by a price change.
Determinants of Supply
Seven main factors can shift the supply curve:
Prices of factors of production: Higher input costs decrease supply.
Prices of related goods produced: Substitutes and complements in production.
Expected future prices: If prices are expected to rise, current supply decreases.
Taxes and subsidies
Number of suppliers: More suppliers increase supply.
Technology: Advances increase supply.
State of nature: Natural events can increase or decrease supply.
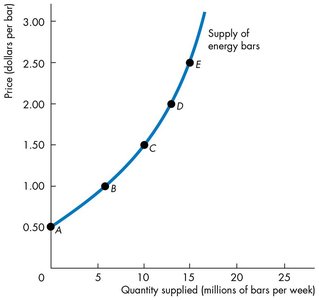
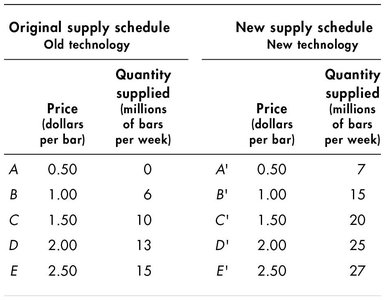
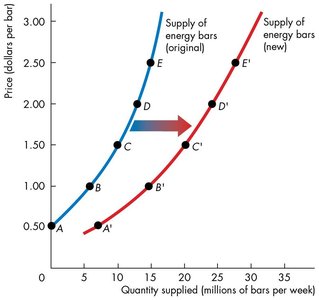
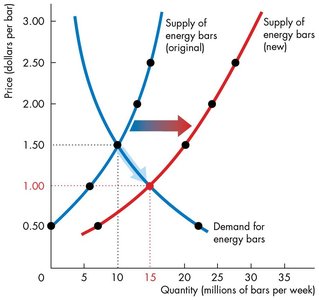
Example: Technology and Supply
Technological advances increase supply, shifting the supply curve rightward. The table below compares the original and new supply schedules for energy bars after a technological improvement:
Price (dollars per bar) | Quantity supplied (old tech) | Price (dollars per bar) | Quantity supplied (new tech) |
|---|---|---|---|
0.50 | 0 | 0.50 | 7 |
1.00 | 6 | 1.00 | 15 |
1.50 | 10 | 1.50 | 20 |
2.00 | 13 | 2.00 | 25 |
2.50 | 15 | 2.50 | 27 |
Market Equilibrium
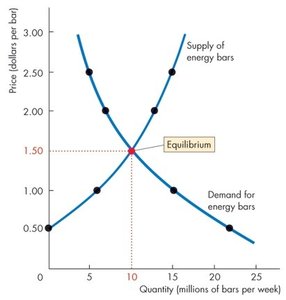
Definition and Determination
Market equilibrium occurs when the quantity demanded equals the quantity supplied at a particular price, known as the equilibrium price. The corresponding quantity is the equilibrium quantity. At this point, buyers' and sellers' plans are in balance, and there is no tendency for price to change unless demand or supply shifts.
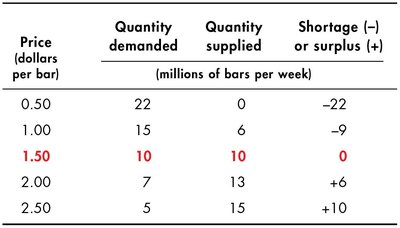
Shortages and Surpluses
If the price is below equilibrium, quantity demanded exceeds quantity supplied, creating a shortage and pushing the price up. If the price is above equilibrium, quantity supplied exceeds quantity demanded, creating a surplus and pushing the price down.
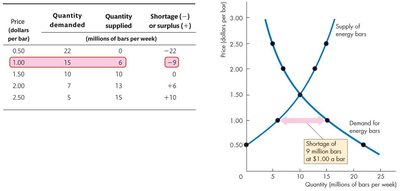
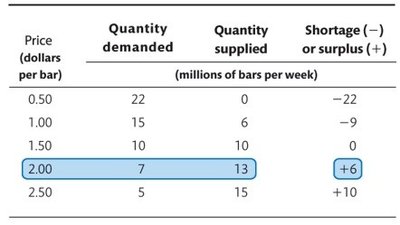
Equilibrium Table Example
Price (dollars per bar) | Quantity demanded | Quantity supplied | Shortage (–) or surplus (+) |
|---|---|---|---|
0.50 | 22 | 0 | –22 |
1.00 | 15 | 6 | –9 |
1.50 | 10 | 10 | 0 |
2.00 | 7 | 13 | +6 |
2.50 | 5 | 15 | +10 |
Predicting Changes in Price and Quantity (Comparative Statics)
Shifts in Demand and Supply
Changes in demand or supply shift the respective curves, leading to new equilibrium prices and quantities:
Increase in demand: Raises both equilibrium price and quantity.
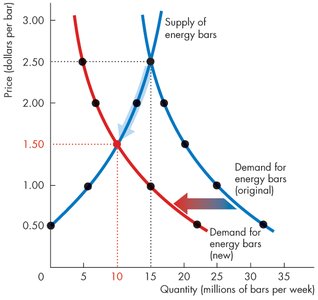
Decrease in demand: Lowers both equilibrium price and quantity.
Increase in supply: Lowers equilibrium price, raises equilibrium quantity.
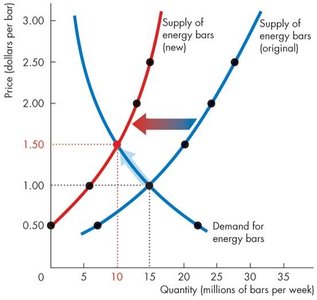
Decrease in supply: Raises equilibrium price, lowers equilibrium quantity.
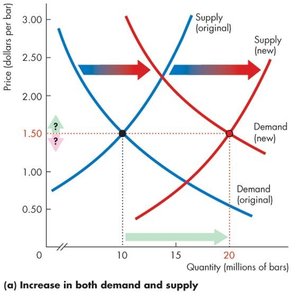
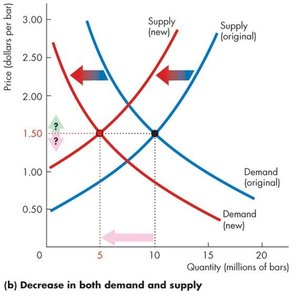
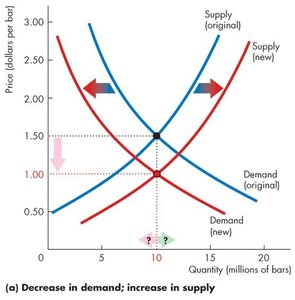
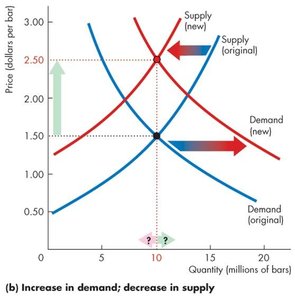
Simultaneous Changes in Demand and Supply
When both demand and supply change, the effect on equilibrium price or quantity may be uncertain and depends on the magnitude of the shifts:
Both increase: Equilibrium quantity rises; price change is uncertain.
Both decrease: Equilibrium quantity falls; price change is uncertain.
Demand increases, supply decreases: Price rises; quantity change is uncertain.
Demand decreases, supply increases: Price falls; quantity change is uncertain.
Summary Table: Effects of Changes in Demand and Supply
Change | Price | Quantity |
|---|---|---|
Demand ↑ | Rises | Rises |
Demand ↓ | Falls | Falls |
Supply ↑ | Falls | Rises |
Supply ↓ | Rises | Falls |
Key Takeaways
Understand the underlying factors of demand and supply.
Recognize the determinants that shift demand and supply curves.
Distinguish between changes in demand/supply and changes in quantity demanded/supplied.
Identify the equilibrium price and quantity in a market.
Predict the effects of changes in demand and supply on market equilibrium.
