 Back
BackMicroeconomics: Demand, Supply, Market Equilibrium, and Government Intervention
Study Guide - Smart Notes
 Tailored notes based on your materials, expanded with key definitions, examples, and context.
Demand and Supply: Foundations of Market Analysis
Determinants and Shifts of Demand and Supply
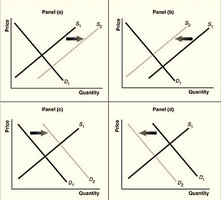
The demand and supply model is central to microeconomics, describing how prices and quantities are determined in markets. The demand curve shows the relationship between the price of a good and the quantity demanded, while the supply curve shows the relationship between price and quantity supplied. Shifts in these curves are caused by factors other than the good's own price.
Demand Shifters: Income (normal/inferior goods), prices of substitutes/complements, tastes/preferences, population/demographics, expected price, natural disasters/pandemics.
Supply Shifters: Technological change, number of firms, input prices, prices of substitutes in production, expected price, natural disasters/pandemics.

Key Rule: A change in the price of the good itself causes a movement along the curve (change in quantity demanded or supplied), not a shift of the curve.
Law of Demand and Movements Along the Curve
The Law of Demand states that, ceteris paribus, as the price of a good falls, the quantity demanded increases (and vice versa). This is represented as a downward-sloping demand curve.
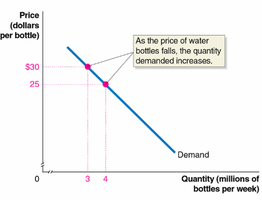
Example: If the price of water bottles falls from $30 to $25, the quantity demanded increases from 3 to 4 million bottles per week.
Supply Shifts: Input Prices and Market Effects
Changes in input prices, such as wages, can shift the supply curve. An increase in input prices raises production costs, shifting the supply curve to the left (decrease in supply).
Example: If the wages of seamstresses rise, the supply of women's clothing decreases, shifting the supply curve leftward.
Market Equilibrium and Surplus/Shortage
Market equilibrium occurs where the demand and supply curves intersect, determining the equilibrium price and quantity. If the market price is above equilibrium, a surplus results; if below, a shortage occurs.
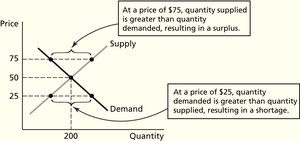
Surplus: Quantity supplied > Quantity demanded (e.g., at $75, surplus exists).
Shortage: Quantity demanded > Quantity supplied (e.g., at $25, shortage exists).
Consumer and Producer Surplus, Deadweight Loss, and Government Intervention
Economic Surplus in Equilibrium
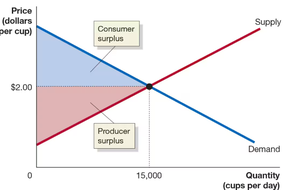
Consumer Surplus (CS) is the area above the equilibrium price and below the demand curve, representing the net benefit to consumers. Producer Surplus (PS) is the area below the equilibrium price and above the supply curve, representing the net benefit to producers.
Deadweight Loss from Market Distortions
When markets are not in equilibrium due to price controls or taxes, deadweight loss (DWL) occurs, representing lost total surplus.
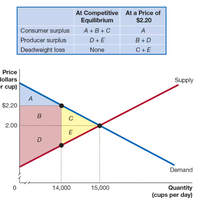
Example: At a price above equilibrium, CS and PS shrink, and DWL appears to the right of the quantity produced.
Rent Control and Surplus Calculation
Price ceilings (e.g., rent control) set a legal maximum price. This creates a shortage and redistributes surplus.
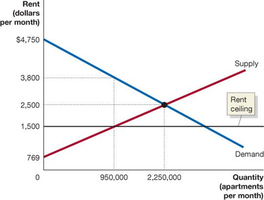
Consumer Surplus: A + B + C Producer Surplus: F Deadweight Loss: D + E
Taxes and Market Efficiency
Taxes create a wedge between the price buyers pay and the price sellers receive, reducing equilibrium quantity and generating tax revenue for the government. Part of the lost surplus becomes government revenue, and part becomes deadweight loss.
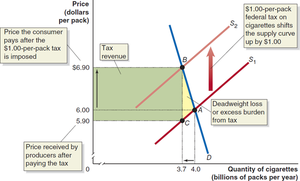
Tax Revenue: Area of the green box between supply and demand after tax.
Deadweight Loss: Area of the yellow triangle, representing lost surplus due to reduced transactions.
Summary Table: Demand and Supply Shifters
Factor | Effect on Demand | Effect on Supply |
|---|---|---|
Income (Normal Good) | Increase shifts right | No effect |
Input Prices | No effect | Increase shifts left |
Technological Change | No effect | Improvement shifts right |
Price of Substitute | Increase shifts right | Increase shifts left (if substitute in production) |
Expected Price | Increase shifts right | Increase shifts left |
Additional info: Table summarizes main shifters and their effects on demand and supply curves.
