 Back
BackMicroeconomics Diagnostic Mini Exam Study Guidance
Study Guide - Smart Notes
 Tailored notes based on your materials, expanded with key definitions, examples, and context.
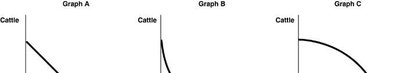
Q9. Sergio Vignetto raises cattle and llamas on his land. His land is equally suitable for raising either animal. Which of the graphs in the Figure represent his production possibilities frontier?
Background
Topic: Production Possibilities Frontier (PPF)
This question tests your understanding of the shape of the PPF when resources are equally suited for producing two goods. The PPF shows the maximum possible output combinations of two goods that can be produced with available resources and technology.
Key Terms:
Production Possibilities Frontier (PPF): A curve depicting all maximum output possibilities for two goods, given a set of inputs.
Opportunity Cost: The value of the next best alternative foregone when making a choice.
Constant Opportunity Cost: Occurs when the trade-off between two goods is always the same, regardless of the quantities produced.
Increasing Opportunity Cost: Occurs when the trade-off between two goods changes as more of one good is produced.
Step-by-Step Guidance
Recall that when resources are equally suited for producing both goods, the opportunity cost of switching production from one good to another remains constant.
Identify the shape of the PPF that represents constant opportunity cost. A straight line PPF indicates constant opportunity cost, while a bowed-out (concave) PPF indicates increasing opportunity cost.
Examine the provided graphs. Look for the graph where the PPF is a straight line between cattle and llamas, rather than curved.
Consider why the other graphs might be curved: If the PPF is bowed out, it suggests resources are not equally suited for both goods, leading to increasing opportunity cost.
Try solving on your own before revealing the answer!
Final Answer: Graph A
Graph A is a straight line, which represents constant opportunity cost. Since Sergio's land is equally suitable for both cattle and llamas, the PPF should be linear.
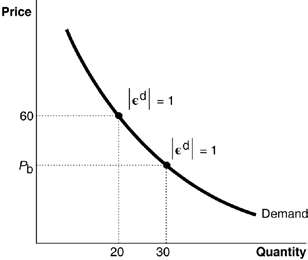
Q11. The absolute value of the price elasticity of demand at points and is 1. What is the value of b?
Background
Topic: Price Elasticity of Demand
This question tests your ability to interpret and calculate price elasticity of demand using a demand curve. Elasticity measures how responsive quantity demanded is to a change in price.
Key Terms and Formulas:
Price Elasticity of Demand ():
Unit Elastic: Elasticity equals 1 in absolute value.
Demand Curve: Shows the relationship between price and quantity demanded.
Step-by-Step Guidance
Observe the demand curve and the points where are marked. These points indicate unit elasticity.
Recall that at unit elasticity, the percentage change in price equals the percentage change in quantity demanded.
Use the midpoint formula for elasticity if needed:
Identify the price and quantity coordinates at the points shown, and set up the equation to solve for using the information provided.
Try solving on your own before revealing the answer!
Final Answer:
At unit elasticity, the value of is $40$ based on the demand curve and the points shown.
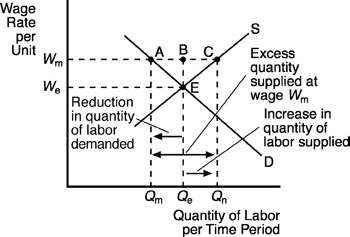
Q13. According to the above figure, if the government imposes a minimum wage equal to Wm, the effect will be:
Background
Topic: Minimum Wage and Labor Markets
This question tests your understanding of how a minimum wage above equilibrium affects labor supply and demand. The figure shows the labor market with wage rates and quantities of labor.
Key Terms:
Minimum Wage: A legally mandated lowest wage that can be paid to workers.
Labor Supply: The total hours workers are willing to work at a given wage.
Labor Demand: The total hours employers are willing to hire at a given wage.
Excess Supply: Occurs when labor supplied exceeds labor demanded at a wage above equilibrium.
Step-by-Step Guidance
Identify the equilibrium wage () and equilibrium quantity () in the labor market diagram.
Observe what happens when the minimum wage () is set above the equilibrium wage.
At , the quantity of labor supplied increases (move from A to E), while the quantity of labor demanded decreases (move from Q_e to Q_m).
Recognize that this creates excess supply of labor (unemployment), as more workers want jobs at the higher wage, but fewer jobs are available.
Try solving on your own before revealing the answer!
Final Answer: D) a reduction in employment from Qe to Qm.
The minimum wage causes a decrease in employment, as shown by the movement from Qe to Qm in the diagram.
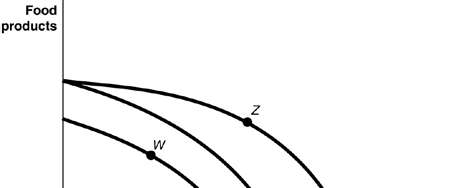
Q17. A movement from W to Z could occur because of:
Background
Topic: Shifts in Production Possibilities Frontier (PPF)
This question tests your understanding of what causes shifts in the PPF, such as technological advancements or changes in resources.
Key Terms:
PPF Shift: Indicates a change in the economy's ability to produce goods, often due to technology or resources.
Advancements in Technology: Can increase production possibilities for one or both goods.
Resource Allocation: Changes in available resources can shift the PPF.
Step-by-Step Guidance
Identify the points W and Z on the PPF diagram. W is on the inner curve, Z is on the outer curve.
Recognize that a movement from W to Z represents an outward shift of the PPF, indicating increased production capacity.
Consider what could cause this shift: Advancements in technology for food products, plastic products, or both.
Determine whether the shift is due to changes in one sector or both, based on the direction and shape of the shift.
Try solving on your own before revealing the answer!
Final Answer: D) is the result of advancements in food production technology only, with no change in the technology for plastic production.
The outward shift from W to Z is due to increased production possibilities for food products.
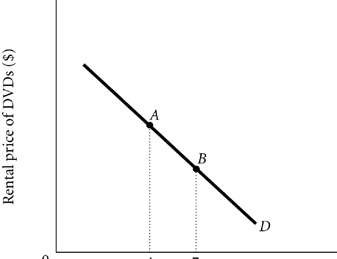
Q23. Refer to Figure above. The number of DVDs Isabel rents per week decreases from 7 to 4. This is caused by:
Background
Topic: Demand Curve and Determinants of Demand
This question tests your understanding of factors that shift the demand curve, such as changes in price, income, or prices of related goods.
Key Terms:
Demand Curve: Shows the relationship between price and quantity demanded.
Substitute Goods: Goods that can replace each other in consumption.
Complement Goods: Goods that are consumed together.
Normal Good: A good for which demand increases as income increases.
Step-by-Step Guidance
Observe the decrease in quantity rented from 7 to 4 DVDs per week.
Consider possible causes: increase in price of DVDs, decrease in price of substitutes, increase in price of complements, or decrease in income (if DVDs are a normal good).
Analyze the figure to see if the change is due to a movement along the curve (price change) or a shift of the curve (other factors).
Match the scenario to the most likely cause based on the options provided.
Try solving on your own before revealing the answer!
Final Answer: A) an increase in the rental price of DVDs.
The decrease in quantity rented is most likely due to an increase in the price of DVDs, causing movement along the demand curve.
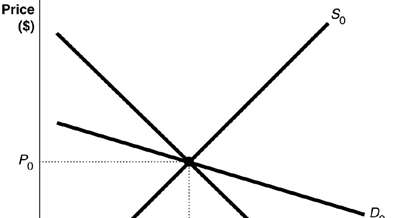
Q40. Suppose the market is initially in equilibrium at price 0 and then the government imposes a tax on every unit sold. Which of the following statements best describes the impact of the tax?
Background
Topic: Tax Incidence and Elasticity
This question tests your understanding of how the burden of a tax is shared between consumers and producers, depending on the elasticity of demand and supply.
Key Terms:
Tax Incidence: The division of the tax burden between buyers and sellers.
Elasticity: Measures responsiveness of quantity demanded or supplied to price changes.
Demand Curve: D0 (more elastic), D1 (less elastic).
Step-by-Step Guidance
Identify the initial equilibrium price and quantity in the market diagram.
Understand that a tax shifts the supply curve upward by the amount of the tax.
Analyze how the burden of the tax is shared: If demand is more elastic (D0), consumers bear less of the tax; if demand is less elastic (D1), consumers bear more of the tax.
Compare the relative elasticities of D0 and D1 to determine who bears a larger share of the tax burden.
Try solving on your own before revealing the answer!
Final Answer: B) The consumer will bear a smaller share of the tax burden if the demand curve is D0.
When demand is more elastic, consumers can avoid the tax more easily, so producers bear a larger share of the burden.
