 Back
BackMicroeconomics Diagnostic Quiz – Step-by-Step Guidance
Study Guide - Smart Notes
 Tailored notes based on your materials, expanded with key definitions, examples, and context.
Q4. Graphing a Linear Demand Function
Background
Topic: Demand Functions and Graphing
This question tests your understanding of how to graph a linear demand function, identify intercepts, and calculate the slope. These are foundational skills in microeconomics for analyzing market demand.
Key Terms and Formulas
Demand Function: A mathematical relationship showing how quantity demanded (Q) depends on price (P).
Intercepts: The points where the graph crosses the axes (Q-intercept and P-intercept).
Slope: The rate at which P changes as Q changes. For a linear function , the slope is .
Step-by-Step Guidance
Start with the given demand function: .
To find the P-intercept (where ), substitute $Q = 0$ into the equation and solve for .
To find the Q-intercept (where ), set $P = 0$ and solve for .
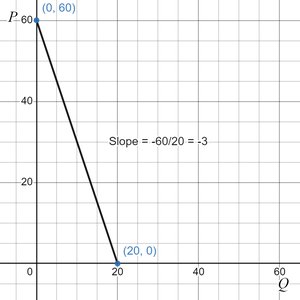
Plot these two intercepts on the graph: one at and one at .
Calculate the slope of the line. The slope is the coefficient of in the equation, which tells you how much decreases as $Q$ increases by 1 unit.
Try solving on your own before revealing the answer!
Final Answer:
The P-intercept is at and the Q-intercept is at . The slope of the demand function is , indicating that for each additional unit of , decreases by 3 units. The graph is a straight line connecting these two intercepts.
