 Back
BackMicroeconomics Foundations and Models: Chapter 1 Study Guide
Study Guide - Smart Notes
 Tailored notes based on your materials, expanded with key definitions, examples, and context.
Economics: Foundations and Models
Three Key Economic Ideas
Economics is built on three fundamental concepts: rationality, incentives, and marginal analysis. These principles guide the behavior of individuals and firms in markets.
People Are Rational: Economic agents use available information to make decisions that maximize their objectives. Rationality implies weighing costs and benefits before acting.
People Respond to Economic Incentives: Changes in incentives alter behavior. For example, stricter penalties for crime reduce repeat offenses, and government policies can unintentionally affect market outcomes.
Optimal Decisions Are Made at the Margin: Most choices involve incremental adjustments. Marginal analysis compares the additional benefit (marginal benefit) and additional cost (marginal cost) of an action.
Example: Deciding whether to study an extra hour or watch TV involves comparing the marginal benefit of improved grades to the marginal cost of lost leisure.

Additional info: Marginal analysis is central to microeconomic decision-making, such as pricing, production, and consumption choices.
The Economic Problem That Every Society Must Solve
Scarcity forces societies to make choices about resource allocation. Every economy must answer three basic questions:
What goods and services will be produced? Due to limited resources, producing more of one good means producing less of another. This is known as a trade-off.
Opportunity Cost: The value of the next best alternative forgone when a choice is made. Example: Funding space exploration may mean less funding for cancer research.
How will goods and services be produced? Firms choose production methods based on costs and available technology. Example: Using machines versus labor, or relocating production to areas with cheaper labor.
Who will receive the goods and services produced? Distribution is often based on income, but government policies can alter this through taxes and welfare.
Centrally Planned Economies Versus Market Economies
Economic systems differ in how resources are allocated:
Centrally Planned Economy: The government decides allocation.
Market Economy: Allocation is determined by households and firms interacting in markets.
Mixed Economy: Most modern economies, including the U.S., combine market mechanisms with government intervention.
Efficiency and Equity in Market Economies
Market economies are generally more efficient, but not always equitable.
Productive Efficiency: Goods and services are produced at the lowest possible cost.
Allocative Efficiency: Production aligns with consumer preferences; the last unit produced provides a marginal benefit equal to its marginal cost.
Voluntary Exchange: Transactions benefit both buyers and sellers.
Equity: Refers to the fair distribution of economic benefits. Governments often face trade-offs between efficiency and equity.
Economic Models
Economists use models to simplify and analyze real-world situations. The process involves:
Deciding on assumptions
Formulating a testable hypothesis
Using data to test the hypothesis
Revising the model if necessary
Assumptions: Models require simplifications, such as assuming consumers maximize well-being and firms maximize profit.
Hypotheses: Statements about economic variables, often concerning causal relationships.
Positive vs. Normative Analysis:
Positive Analysis: Concerned with what is.
Normative Analysis: Concerned with what ought to be.
Example: Economic analysis of tariffs can estimate gains and losses, but policy decisions may involve normative judgments about fairness.
Microeconomics and Macroeconomics
Economics is divided into two main branches:
Microeconomics: Studies individual households, firms, and markets.
Macroeconomics: Studies the economy as a whole, including inflation, unemployment, and growth.
Economic Skills and Economics as a Career
Studying economics develops analytical skills valuable in many careers. Economists help businesses and governments make better decisions by analyzing choices and their consequences.
Example: Many CEOs of major corporations majored in economics.
Correlation vs. Causation: Higher salaries for economics majors may result from skills learned or self-selection.
A Preview of Important Economic Terms
Economics uses precise terminology. Key terms include:
Scarcity: Unlimited wants versus limited resources.
Technology: Processes used to produce goods and services.
Capital: Manufactured goods used in production.
Appendix: Using Graphs and Formulas
Graphs in Economics
Graphs are essential tools for visualizing economic relationships. Common types include bar graphs, pie charts, and time-series graphs.
Bar Graphs: Show comparisons between categories.
Pie Charts: Show proportions of a whole.
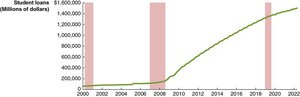
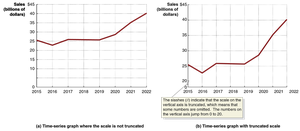
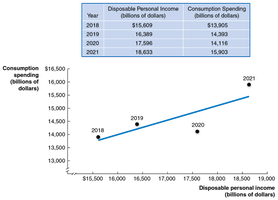
Time-Series Graphs: Show changes over time.

Plotting Price and Quantity
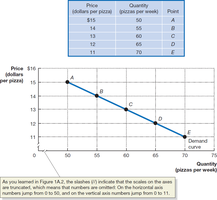
Graphs can illustrate the relationship between price and quantity, such as demand curves.
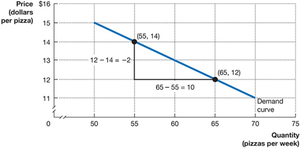
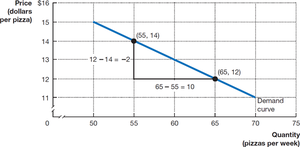
Calculating the Slope of a Line
The slope measures the rate of change between two variables. For a straight line:
Formula:
Example: If price decreases from \frac{12-14}{65-55} = \frac{-2}{10} = -0.2$
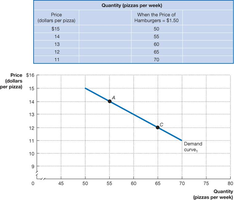
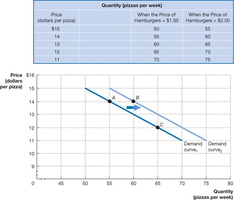
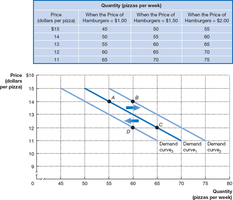
Showing Three Variables on a Graph
Graphs can hold one variable constant while showing the relationship between two others, such as the effect of hamburger prices on pizza demand.
Positive and Negative Relationships
Economic variables can be positively or negatively related. In a positive relationship, both variables increase together; in a negative relationship, one increases as the other decreases.
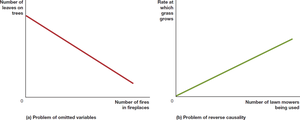
Determining Cause and Effect
Graphs can suggest relationships but do not always prove causality. Problems include omitted variables and reverse causality.
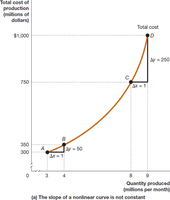
Linear and Nonlinear Relationships
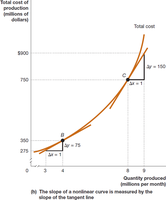
Most economic relationships are not perfectly linear. Nonlinear curves have varying slopes at different points.
Measuring Slope: For nonlinear curves, slope can be approximated over a section or measured by the tangent at a point.
Formula for Percentage Change
Percentage change is used to measure growth or decline in economic variables.
Formula:
Example: U.S. real GDP increased from \frac{20,018 - 19,610}{19,610} \times 100 = 2.1\%$
Graphing Total Revenue and Area Calculations
Graphical analysis can show total revenue as the area of a rectangle (quantity × price) and other economic concepts as areas under curves.
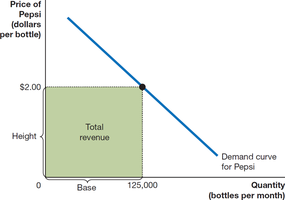
Area of a Rectangle:
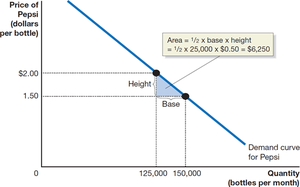
Area of a Triangle:
Summary of Using Formulas
When applying formulas in economics:
Understand the concept the formula represents.
Use the correct formula for the problem.
Check that the result is economically reasonable.
Additional info: Mastery of graphs and formulas is essential for analyzing and solving microeconomic problems.
