 Back
BackMicroeconomics Foundations: Scarcity, Choice, Opportunity Cost, Supply & Demand, Elasticity, and Market Interventions
Study Guide - Smart Notes
 Tailored notes based on your materials, expanded with key definitions, examples, and context.
Introduction to Microeconomics
Scope and Method of Economics
Economics is the study of how individuals, firms, and societies allocate limited resources to satisfy unlimited wants. Microeconomics focuses on the decision-making processes of individuals and firms, as well as the functioning of individual markets.
Scarcity: The fundamental economic problem of having seemingly unlimited human wants in a world of limited resources.
Microeconomics: Studies individual and firm decision-making, and the functioning of specific markets.
Macroeconomics: (Not this course) Studies the economy as a whole, including government policy, inflation, and GDP.
Scarce Goods: Goods are scarce if their availability is limited (e.g., water, cars, diamonds).
Poverty vs. Scarcity: Poverty is an income level below basic needs; scarcity is a universal condition.
Five Foundations of Economics
Incentives: Factors that motivate individuals to act or exert effort. Can be positive (rewards) or negative (penalties).
Trade-offs: Due to scarcity, choosing one thing means giving up something else.
Opportunity Cost: The value of the next best alternative forgone when making a decision.
Marginal Thinking: Evaluating whether the benefit of one more unit of something is greater than its cost.
Trade: Specialization and exchange make all parties better off.
Economic Models and the Scientific Method
Economists use models to simplify reality and test hypotheses.
Key steps: Observe, hypothesize, model, test.
Ceteris Paribus: Holding all else constant to isolate the effect of one variable.
Endogenous Variables: Variables explained within the model.
Exogenous Variables: Variables determined outside the model.
Positive Statements: Testable and verifiable claims.
Normative Statements: Opinion-based, not testable.
Scarcity, Choice, and Opportunity Cost
Opportunity Cost
Opportunity cost is the value of the next best alternative that must be forgone to undertake an activity.
Example: Choosing between bus and plane travel, considering both monetary and time costs.
Formula:
Production Possibility Frontier (PPF)
The PPF shows the maximum combinations of two goods that can be produced with available resources and technology.
Points on the PPF are efficient; inside are inefficient; outside are unattainable.
Opportunity cost increases as more of one good is produced (typically a bowed-out curve).
Investment in capital or technology shifts the PPF outward.
Comparative and Absolute Advantage
Comparative Advantage: The ability to produce a good at a lower opportunity cost than another producer.
Absolute Advantage: The ability to produce more of a good with the same resources than another producer.
Specialization and trade allow all parties to consume beyond their individual PPFs.
Supply and Demand
Law of Demand
The law of demand states that, ceteris paribus, as the price of a good increases, the quantity demanded decreases.
Movement along the demand curve: Change in quantity demanded due to price change.
Shift of the demand curve: Change in demand due to factors other than price (e.g., income, tastes, prices of related goods).
Law of Supply
The law of supply states that, ceteris paribus, as the price of a good increases, the quantity supplied increases.
Movement along the supply curve: Change in quantity supplied due to price change.
Shift of the supply curve: Change in supply due to factors other than price (e.g., input costs, technology, taxes/subsidies).
Market Equilibrium
Market equilibrium occurs where quantity supplied equals quantity demanded. The equilibrium price is where the market clears.
If price is above equilibrium: Surplus (Qs > Qd), price falls.
If price is below equilibrium: Shortage (Qd > Qs), price rises.
Graphical Analysis of Market Changes
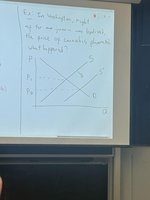
Shifts in demand or supply curves change equilibrium price and quantity.
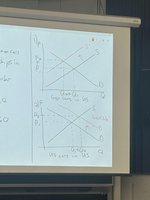
Government interventions (e.g., tariffs, taxes) shift supply or demand and affect market outcomes.
Elasticity
Price Elasticity of Demand
Elasticity measures the responsiveness of quantity demanded to a change in price.
Formula:
Midpoint formula:
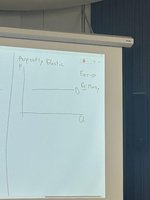
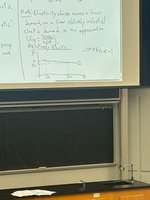
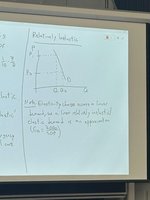
Elasticity classifications:
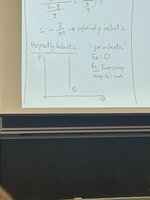
Perfectly inelastic:
Relatively inelastic:
Unitary elastic:
Relatively elastic:
Perfectly elastic:
Determinants: Availability of substitutes, share of budget, time horizon.
Income Elasticity of Demand
Measures how quantity demanded changes as consumer income changes.
Formula:
Interpretation:
Normal good:
Necessity:
Luxury:
Inferior good:
Cross-Price Elasticity of Demand
Measures the responsiveness of demand for one good to the price change of another good.
Formula:
Interpretation:
Substitutes:
Complements:
Price Elasticity of Supply
Measures how quantity supplied responds to price changes.
Formula:
Perfectly inelastic supply: (e.g., oceanfront land)
Relatively inelastic supply: (e.g., cell phone towers)
Consumer and Producer Surplus; Price Ceilings and Price Floors
Consumer Surplus (CS)
The difference between what consumers are willing to pay and what they actually pay.
Producer Surplus (PS)
The difference between the price sellers receive and the minimum they are willing to accept.
Total Surplus (TS)
The sum of consumer and producer surplus. Market equilibrium maximizes total surplus.
Market Efficiency and Equity
Efficient allocation maximizes total surplus.
Equity concerns the fairness of distribution, which is subjective.
Taxes and Deadweight Loss
Taxes create a wedge between the price buyers pay and sellers receive, reducing quantity traded and creating deadweight loss (DWL).
Tax incidence depends on the relative elasticity of demand and supply.
Formulas:
Tax incidence on consumers:
Tax incidence on producers:
Price Ceilings and Price Floors
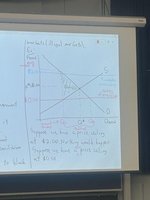
Price Ceiling: Legally imposed maximum price (e.g., rent control). Binding if below equilibrium, causing shortages.
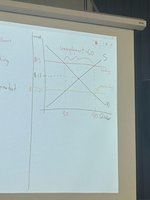
Price Floor: Legally imposed minimum price (e.g., minimum wage). Binding if above equilibrium, causing surpluses (unemployment).
Additional info:
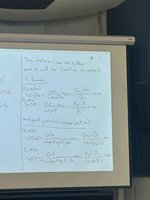
Tables and calculations for opportunity cost, elasticity, and surplus are included in the notes and images. Where calculations are shown, they reinforce the application of formulas and concepts.
All images included are directly relevant to the explanation of elasticity, supply and demand, taxes, and market interventions as described in the paragraphs above.
