 Back
BackMicroeconomics: Indifference Curves, Budget Lines, and Consumer Choice
Study Guide - Smart Notes
 Tailored notes based on your materials, expanded with key definitions, examples, and context.
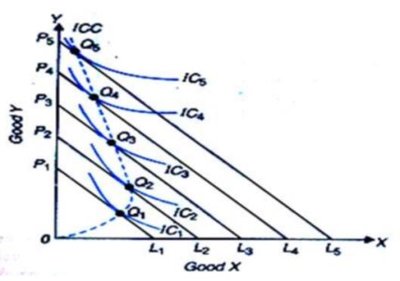
Q1. In the graph below, the solid lines are budget lines. The solid curves are indifference curves. The dashed curve is the income consumption curve. Which of the following statement is correct?
Background
Topic: Income Consumption Curve and Normal vs. Inferior Goods
This question tests your understanding of how changes in income affect the consumption of goods, as represented by shifts in budget lines and movements along indifference curves. The income consumption curve (ICC) traces the consumer's equilibrium as income changes, holding prices constant.

Key Terms and Concepts:
Budget Line: Shows all combinations of two goods that a consumer can afford given their income and the prices of the goods.
Indifference Curve (IC): Represents combinations of goods that provide the consumer with the same level of satisfaction.
Income Consumption Curve (ICC): The locus of consumer equilibrium points as income changes (with prices held constant).
Normal Good: A good for which demand increases as income increases.
Inferior Good: A good for which demand decreases as income increases.
Step-by-Step Guidance
Observe how the budget lines shift: As income increases, the budget lines move outward in a parallel fashion, indicating greater purchasing power.
Follow the equilibrium points (where each budget line is tangent to an indifference curve): These points trace out the income consumption curve (ICC).
Examine the direction of movement along the Good Y axis as income increases: If the quantity of Good Y consumed increases as income rises, Good Y is a normal good.
Consider what would indicate an inferior good: If the quantity of Good Y decreased as income increased, Good Y would be considered an inferior good.
Try solving on your own before revealing the answer!
Final Answer: A. Good Y is a normal Good
As the budget lines shift outward, the equilibrium quantity of Good Y increases, indicating a positive relationship between income and demand for Good Y. This is the definition of a normal good.
Q2. By which assumption, an indifference curve should be thin lines rather than thick ones?
Background
Topic: Properties of Indifference Curves
This question tests your understanding of the basic assumptions underlying consumer preferences and the graphical representation of indifference curves.
Key Terms and Concepts:
Indifference Curve: A curve showing all combinations of two goods that provide the same utility to the consumer.
"More is Better" Assumption: Also called non-satiation, this assumption states that having more of a good always increases utility.
Step-by-Step Guidance
Recall that an indifference curve represents all bundles that yield the same utility.
Consider what would happen if an indifference curve were thick: Some bundles on the thick line would have more of both goods than others, violating the "more is better" assumption.
Think about which assumption ensures that indifference curves cannot be thick: Only the "more is better" assumption guarantees that more of both goods must yield higher utility, so bundles with more of both cannot be on the same indifference curve.
Try solving on your own before revealing the answer!
Final Answer: E. More is better.
The "more is better" assumption ensures that indifference curves are thin, because bundles with more of both goods must lie on a higher indifference curve, not the same one.
