 Back
BackMicroeconomics Midterm Review: Step-by-Step Guidance
Study Guide - Smart Notes
 Tailored notes based on your materials, expanded with key definitions, examples, and context.
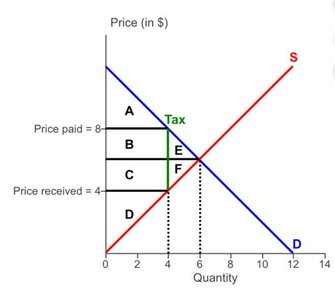
Q17. The figure below shows the effect of a $4 sales tax paid by consumers. What is the consumer surplus after the tax is imposed?
Background
Topic: Consumer Surplus and Tax Incidence
This question tests your understanding of how a tax affects consumer surplus in a market, and how to identify the area representing consumer surplus on a supply and demand diagram after a tax is imposed.
Key Terms and Formulas
Consumer Surplus: The area between the demand curve and the price consumers pay, up to the quantity traded.
Tax Incidence: The division of the tax burden between buyers and sellers, shown by the difference between the price paid by buyers and the price received by sellers.
Step-by-Step Guidance
Identify the price paid by consumers after the tax is imposed (in this diagram, $8).
Locate the new equilibrium quantity after the tax (where the vertical tax wedge separates the supply and demand curves; in this diagram, quantity is 4 units).
Recall that consumer surplus is the area below the demand curve and above the price paid, up to the quantity traded.
On the diagram, find the area(s) above the $8 price line and below the demand curve, up to the new quantity (4 units). These are typically labeled with letters (e.g., A, B, etc.).
Try solving on your own before revealing the answer!
Q18. The deadweight loss incurred in the above figure is represented by ________.
Background
Topic: Deadweight Loss from Taxation
This question tests your ability to identify the deadweight loss caused by a tax, which is the loss in total surplus that results from the tax reducing the quantity traded below the efficient level.
Key Terms and Formulas
Deadweight Loss (DWL): The area representing the reduction in total surplus due to the tax, typically a triangle between the supply and demand curves, from the post-tax quantity to the pre-tax equilibrium quantity.
Step-by-Step Guidance
Identify the pre-tax equilibrium quantity (where supply and demand intersect without the tax).
Identify the post-tax quantity (where the vertical tax wedge separates the supply and demand curves).
Recall that deadweight loss is the area between the supply and demand curves, from the post-tax quantity to the pre-tax equilibrium quantity.
On the diagram, find the area(s) labeled between these two quantities and between the supply and demand curves (often labeled with letters such as E and F, or similar).
Try solving on your own before revealing the answer!
Q28. The graph below shows the average total cost (ATC), average variable cost (AVC), marginal cost (MC), and marginal revenue (MR) curves for a firm in a perfectly competitive market. In order to maximize profits, this firm should produce approximately _________ units of output.
Background
Topic: Profit Maximization in Perfect Competition
This question tests your understanding of how a perfectly competitive firm determines its profit-maximizing output using cost and revenue curves.
Key Terms and Formulas
Marginal Cost (MC): The additional cost of producing one more unit of output.
Marginal Revenue (MR): The additional revenue from selling one more unit of output. In perfect competition, MR equals the market price.
Profit Maximization Rule: A firm maximizes profit where .

Step-by-Step Guidance
Locate the MR curve (horizontal line) on the graph, which represents the market price.
Find the point where the MC curve intersects the MR curve from below. This is the profit-maximizing quantity.
Check that at this quantity, the price (MR) is above the AVC curve, ensuring the firm should produce in the short run.
Read the quantity value at the intersection point from the horizontal axis.
Try solving on your own before revealing the answer!
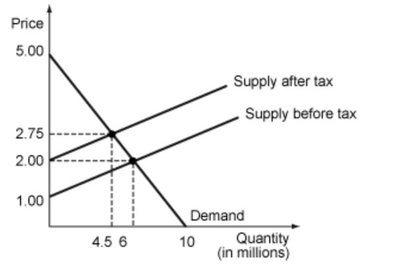
Q33. The figure below shows the demand and the supply in a market before and after a tax is imposed. The demand and the supply curves are straight lines. What is the government's tax revenue?
Background
Topic: Tax Revenue Calculation
This question tests your ability to calculate the total tax revenue collected by the government after a tax is imposed, using the supply and demand diagram.
Key Terms and Formulas
Tax Revenue: The total amount of money collected by the government from the tax, calculated as the tax per unit times the quantity sold after the tax.
Formula:
Step-by-Step Guidance
Identify the vertical distance between the supply curves (before and after tax), which represents the tax per unit.
Find the new equilibrium quantity after the tax is imposed (where the new supply curve intersects demand).
Multiply the tax per unit by the new equilibrium quantity to set up the calculation for total tax revenue.
Be sure to use the correct units (e.g., millions) as indicated on the graph.
Try solving on your own before revealing the answer!
