 Back
BackMicroeconomics Midterm Study Guidance: Surplus, Elasticity, Tax, Production, and Externalities
Study Guide - Smart Notes
 Tailored notes based on your materials, expanded with key definitions, examples, and context.
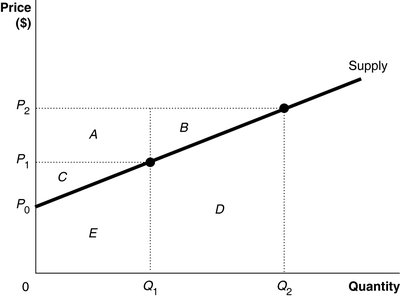
Q1. What area represents producer surplus at a price of P1?
Background
Topic: Producer Surplus
This question tests your understanding of producer surplus, which is the difference between the price producers receive and the minimum price they are willing to accept. It is typically illustrated as the area above the supply curve and below the market price.
Key Terms and Formulas:
Producer Surplus: The area between the supply curve and the market price, up to the quantity sold.
Supply Curve: Shows the minimum price at which producers are willing to sell each unit.
Step-by-Step Guidance
Identify the market price () and the corresponding quantity () on the supply curve.
Locate the area above the supply curve and below the price line , from $0Q_1$.
Refer to the labeled regions in the diagram to determine which area(s) fit this description.
Try solving on your own before revealing the answer!
Final Answer: Area C
At price , producer surplus is represented by area C, which is above the supply curve and below the price line up to .
Q2. What area represents the increase in producer surplus when the market price rises from P1 to P2?
Background
Topic: Changes in Producer Surplus
This question tests your ability to identify how producer surplus changes when the market price increases. The increase is the area between the old and new price lines, above the supply curve.
Key Terms and Formulas:
Producer Surplus Increase: The area between the supply curve and the new price, minus the area between the supply curve and the old price.
Step-by-Step Guidance
Identify the two price levels: (original) and (new).
Find the area between the supply curve and , and subtract the area between the supply curve and .
Refer to the diagram to see which labeled regions correspond to this change.
Try solving on your own before revealing the answer!
Final Answer: Area A + B
The increase in producer surplus when price rises from to is represented by areas A and B.
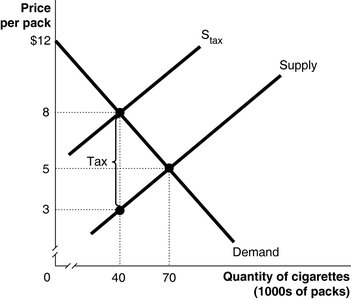
Q3. What is the size of the per-unit tax in the cigarette market diagram?
Background
Topic: Tax Incidence and Market Effects
This question tests your ability to interpret a supply and demand diagram with a per-unit tax. The vertical distance between the supply curve and the supply curve with tax () represents the tax amount.
Key Terms and Formulas:
Per-unit Tax: The difference between the price buyers pay and the price sellers receive after the tax is imposed.
Tax Incidence: How the tax burden is shared between buyers and sellers.
Step-by-Step Guidance
Identify the price buyers pay after the tax () and the price sellers receive ().
Find the vertical distance between these two prices on the diagram.
Refer to the labeled price points to determine the size of the tax.
Try solving on your own before revealing the answer!
Final Answer: $5
The per-unit tax is the vertical distance between the supply curves, which is .
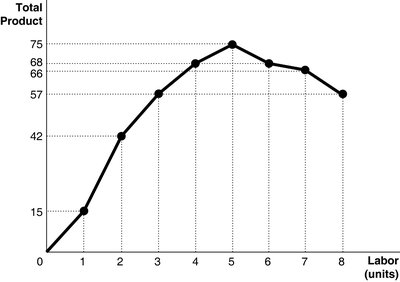
Q4. What is the marginal product of the 3rd worker?
Background
Topic: Marginal Product of Labor
This question tests your understanding of how to calculate the marginal product, which is the additional output produced by hiring one more worker.
Key Terms and Formulas:
Marginal Product (MP):
Total Product: The total output produced by all workers.
Step-by-Step Guidance
Find the total product with 2 workers and with 3 workers from the diagram.
Calculate the difference:
Refer to the graph to read the values for total product at each labor input.
Try solving on your own before revealing the answer!
Final Answer: 15
The marginal product of the 3rd worker is the increase in total product from hiring the 3rd worker, which is 15 units.
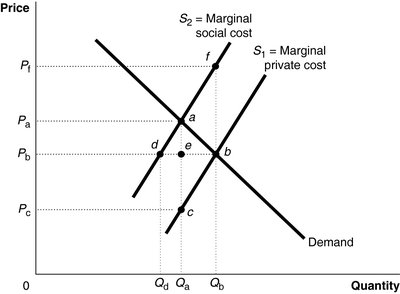
Q5. What is the socially optimal quantity of ground beef when there is an external cost?
Background
Topic: Externalities and Social Optimum
This question tests your understanding of how external costs affect the efficient quantity in a market. The socially optimal quantity is where the marginal social cost equals the marginal benefit (demand).
Key Terms and Formulas:
Marginal Social Cost (MSC): The sum of marginal private cost and external cost.
Social Optimum: Where (Marginal Benefit).
Step-by-Step Guidance
Shift the supply curve upward by the amount of the external cost to get the marginal social cost curve.
Find the intersection of the marginal social cost curve and the demand curve.
Refer to the diagram to identify the quantity at this intersection.
Try solving on your own before revealing the answer!
Final Answer:
The socially optimal quantity is , where the marginal social cost curve intersects the demand curve.
