 Back
BackMicroeconomics Study Guidance: Utility, Demand, and Consumer Choice
Study Guide - Smart Notes
 Tailored notes based on your materials, expanded with key definitions, examples, and context.
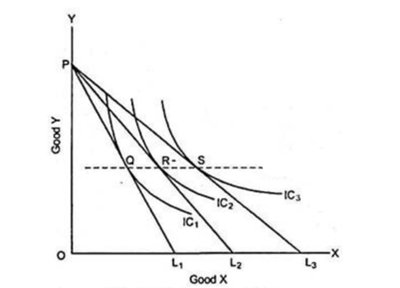
Q1. The horizontal dotted line below is a/an ___.
Background
Topic: Income-Consumption Curve
This question is testing your understanding of how changes in income affect the consumer's optimal choice of goods, and how these choices are represented graphically.
Key Terms and Formulas:
Income-Consumption Curve (ICC): A curve that traces the utility-maximizing combinations of two goods as income changes, holding prices constant.
Indifference Curve: A curve representing combinations of goods that provide the consumer with the same level of satisfaction.
Budget Line: Represents all combinations of goods that a consumer can afford given their income and the prices of the goods.
Step-by-Step Guidance
Examine the graph: The horizontal dotted line is drawn parallel to the X-axis, intersecting several points (Q, R, S) on different indifference curves and budget lines.
Recall that when income changes (with prices held constant), the consumer's budget line shifts outward or inward, and the optimal consumption bundle moves along the income-consumption curve.
The horizontal dotted line connects points of utility maximization for different income levels, showing how the consumption of Good X changes as income changes.
Compare this to other curves: The price-consumption curve traces optimal choices as the price of one good changes, while the Engel curve relates income to the quantity consumed of a good.
Try solving on your own before revealing the answer!
Final Answer: Income-Consumption Curve
The horizontal dotted line is the income-consumption curve, which traces the utility-maximizing market baskets as income changes.
This curve helps us understand how a consumer's choices evolve with changes in income, holding prices constant.
