Back
Microeconomics Study Guide: Demand, Supply, and Market Analysis
Study Guide - Smart Notes
 Tailored notes based on your materials, expanded with key definitions, examples, and context.
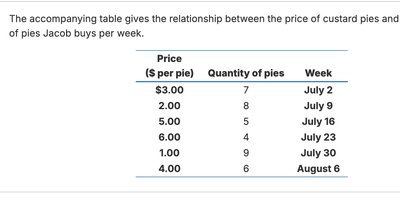
Q1. The accompanying table gives the relationship between the price of custard pies and the number of pies Jacob buys per week.
Background
Topic: Law of Demand and Demand Schedules
This question is testing your understanding of how price changes affect the quantity demanded, and how to interpret a demand schedule.
Key Terms and Formulas:
Demand Schedule: A table showing the relationship between the price of a good and the quantity demanded.
Law of Demand: As the price of a good increases, the quantity demanded decreases, ceteris paribus (all else equal).
Step-by-Step Guidance
Examine the table and note the pairs of price and quantity for each week.
Observe how the quantity of pies Jacob buys changes as the price per pie changes.
Identify whether the relationship between price and quantity is positive or negative (i.e., does quantity go up or down as price increases?).
Think about how this relationship illustrates the law of demand.
Try solving on your own before revealing the answer!
Final Answer:
The relationship is a negative relationship: as the price of pies increases, the quantity Jacob buys decreases. This is consistent with the law of demand.
Q2. Plot the data from the table and draw the demand curve.
Background
Topic: Graphing Demand Curves
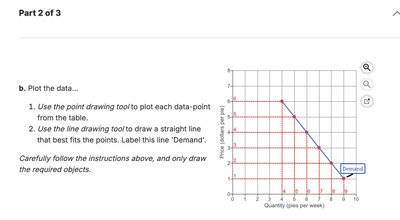
This question tests your ability to plot a demand schedule on a graph and draw the corresponding demand curve.
Key Terms and Formulas:
Demand Curve: A graphical representation of the demand schedule, showing the relationship between price and quantity demanded.
Step-by-Step Guidance
On the graph, label the horizontal axis as "Quantity (pies per week)" and the vertical axis as "Price ($ per pie)".
Plot each data point from the table: for each price, mark the corresponding quantity.
After plotting all points, use a straight line or smooth curve to connect the points, showing the demand curve.
Label the line as "Demand".
Try solving on your own before revealing the answer!
Final Answer:
The demand curve is downward sloping, reflecting the negative relationship between price and quantity demanded. Each point on the curve corresponds to a price-quantity pair from the table.
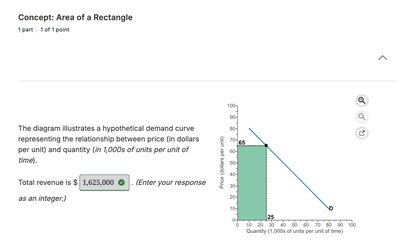
Q3. The diagram illustrates a hypothetical demand curve representing the relationship between price (in dollars per unit) and quantity (in 1,000s of units per unit of time). What is the total revenue?
Background
Topic: Total Revenue Calculation
This question tests your ability to calculate total revenue from a demand curve using the area of a rectangle.
Key Terms and Formulas:
Total Revenue (TR): The total amount of money received from selling a certain quantity of goods, calculated as .
Step-by-Step Guidance
Identify the price and quantity at the relevant point on the demand curve (where the rectangle is shaded).
Recall that total revenue is the area of the rectangle formed by price and quantity: .
Multiply the price (vertical side) by the quantity (horizontal side) to set up the calculation.
Try solving on your own before revealing the answer!
Final Answer:
Total revenue is .
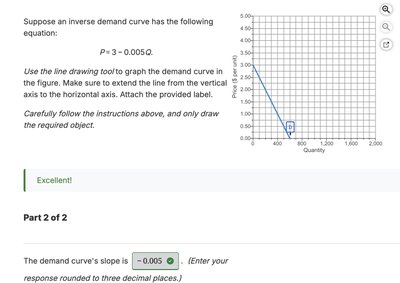
Q4. Suppose an inverse demand curve has the following equation: . What is the slope of the demand curve?
Background
Topic: Demand Curve Equations and Slope
This question tests your understanding of how to interpret and calculate the slope from an inverse demand equation.
Key Terms and Formulas:
Inverse Demand Curve: An equation expressing price as a function of quantity: .
Slope: The coefficient of in the equation, which shows the rate at which price changes as quantity changes.
Step-by-Step Guidance
Identify the coefficient of in the equation .
Recall that the slope of the demand curve is the change in price per unit change in quantity, which is in this case.
Be sure to include the negative sign, as demand curves typically slope downward.
Try solving on your own before revealing the answer!
Final Answer:
The slope of the demand curve is . This negative value reflects the inverse relationship between price and quantity demanded.
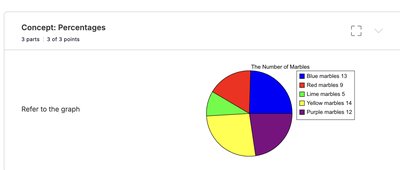
Q5. Refer to the pie chart showing the number of marbles of each color. What is the proportion of blue marbles as a percentage?
Background
Topic: Percentages and Proportions
This question tests your ability to calculate the percentage of a part relative to the whole using data from a pie chart.
Key Terms and Formulas:
Percentage:
Step-by-Step Guidance
Count the number of blue marbles from the chart.
Add up the total number of marbles of all colors.
Divide the number of blue marbles by the total number of marbles.
Multiply the result by 100 to convert it to a percentage.
Try solving on your own before revealing the answer!
Final Answer:
The proportion of blue marbles as a percentage is 24.53% (rounded to two decimal places).
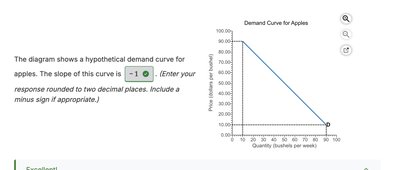
Q6. The diagram shows a hypothetical demand curve for apples. What is the slope of this curve?
Background
Topic: Slope of a Linear Demand Curve
This question tests your ability to calculate the slope of a straight-line demand curve from a graph.
Key Terms and Formulas:
Slope: , where is the change in price and is the change in quantity.
Step-by-Step Guidance
Identify two points on the demand curve from the graph.
Calculate the change in price () and the change in quantity () between these two points.
Divide the change in price by the change in quantity to find the slope.
Try solving on your own before revealing the answer!
Final Answer:
The slope of the demand curve is . This negative value indicates the inverse relationship between price and quantity demanded.