 Back
BackMicroeconomics Study Guide: Demand, Supply, Surplus, and Market Equilibrium
Study Guide - Smart Notes
 Tailored notes based on your materials, expanded with key definitions, examples, and context.
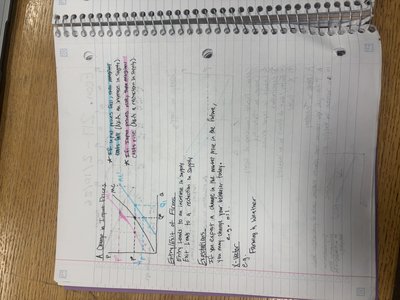
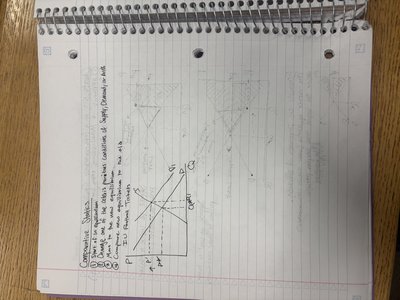
Demand and Supply
Law of Demand and Law of Supply
The Law of Demand states that, ceteris paribus, as the price of a good increases, the quantity demanded decreases. Conversely, the Law of Supply states that as the price of a good increases, the quantity supplied increases. These laws form the foundation of market analysis in microeconomics.
Demand Curve: Downward sloping, showing inverse relationship between price and quantity demanded.
Supply Curve: Upward sloping, showing direct relationship between price and quantity supplied.
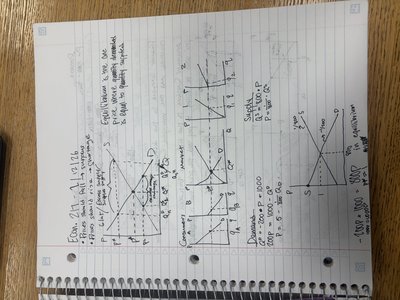
Market Equilibrium: Occurs where the demand and supply curves intersect, determining the equilibrium price and quantity.
Shifts vs. Movements: A movement along the curve is caused by a change in price; a shift is caused by changes in other factors (income, tastes, etc.).
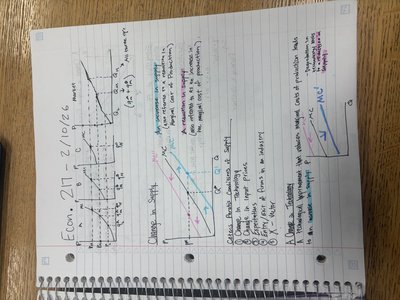
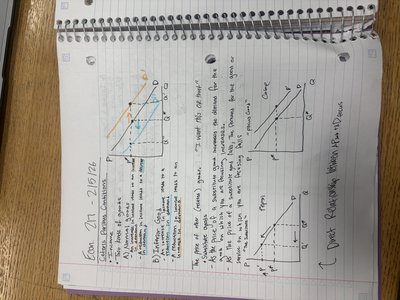
Changes in Demand and Supply
Changes in demand or supply are represented by shifts of the respective curves. Factors affecting demand include income, preferences, prices of related goods, and expectations. Factors affecting supply include input prices, technology, and number of sellers.
Increase in Demand: Demand curve shifts right; equilibrium price and quantity rise.
Decrease in Demand: Demand curve shifts left; equilibrium price and quantity fall.
Increase in Supply: Supply curve shifts right; equilibrium price falls, quantity rises.
Decrease in Supply: Supply curve shifts left; equilibrium price rises, quantity falls.
Consumer and Producer Surplus
Definitions and Graphical Representation
Consumer Surplus is the difference between what consumers are willing to pay for a good and what they actually pay. Producer Surplus is the difference between the price producers receive and the minimum price they are willing to accept. Both are measures of economic welfare.
Consumer Surplus: Area above the equilibrium price and below the demand curve.
Producer Surplus: Area below the equilibrium price and above the supply curve.
Total Surplus: Sum of consumer and producer surplus; maximized at market equilibrium.
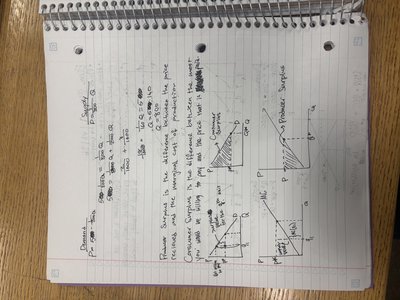
Calculating Surplus
Surplus can be calculated using the area of triangles on the supply and demand graph:
Consumer Surplus Formula:
Producer Surplus Formula:
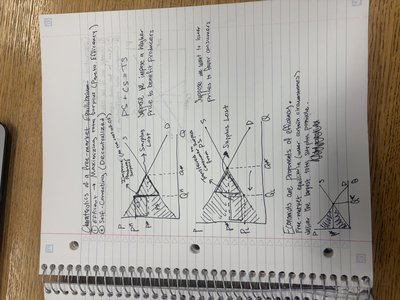
Market Efficiency and Deadweight Loss
Characteristics of Efficient Markets
An efficient market maximizes total surplus. Any deviation from equilibrium (such as price controls or taxes) creates deadweight loss, which is a loss of total surplus due to inefficiency.
Deadweight Loss: Area representing lost surplus due to market distortion.
Causes: Price floors, price ceilings, taxes, subsidies.
Graphical Representation: Deadweight loss is shown as the area between the supply and demand curves that is not realized due to the intervention.
Elasticity
Price Elasticity of Demand and Supply
Elasticity measures the responsiveness of quantity demanded or supplied to changes in price. It is a key concept for understanding how markets react to changes.
Price Elasticity of Demand:
Price Elasticity of Supply:
Interpretation: If , demand or supply is elastic; if , it is inelastic.
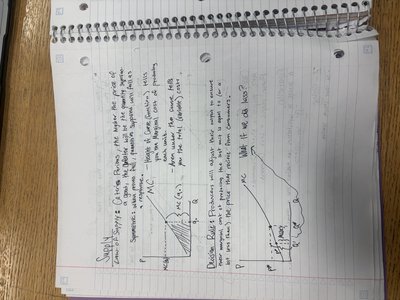
Cost Concepts in Microeconomics
Marginal Cost, Average Cost, and Total Cost
Cost concepts are essential for understanding firm behavior and supply decisions. Marginal Cost (MC) is the cost of producing one more unit. Average Cost (AC) is the total cost divided by the number of units produced. Total Cost (TC) is the sum of all costs incurred in production.
Marginal Cost Formula:
Average Cost Formula:
Graphical Representation: MC and AC curves are used to analyze firm production decisions.
Summary Table: Surplus and Efficiency
The following table summarizes the relationships between consumer surplus, producer surplus, total surplus, and deadweight loss:
Concept | Definition | Graphical Area |
|---|---|---|
Consumer Surplus | Willingness to pay minus price paid | Above price, below demand curve |
Producer Surplus | Price received minus minimum acceptable price | Below price, above supply curve |
Total Surplus | Sum of consumer and producer surplus | Area between supply and demand curves up to equilibrium |
Deadweight Loss | Loss of surplus due to inefficiency | Area between supply and demand curves not realized |
Applications and Examples
Market Interventions
Government interventions such as taxes, subsidies, price floors, and price ceilings affect market equilibrium and can create deadweight loss. Understanding these effects is crucial for evaluating policy decisions.
Price Floor: Minimum price set above equilibrium; leads to surplus.
Price Ceiling: Maximum price set below equilibrium; leads to shortage.
Tax: Shifts supply curve; reduces equilibrium quantity and creates deadweight loss.

Production Decisions
Firms use cost concepts to decide how much to produce. The intersection of marginal cost and marginal revenue determines optimal output.
Profit Maximization: Occurs where .
Short-run vs. Long-run: In the short run, firms may operate at a loss; in the long run, only efficient firms survive.
Additional info:
Some diagrams and tables were inferred for completeness and clarity.
Notes cover core microeconomics topics: demand, supply, surplus, efficiency, elasticity, and cost concepts.
