 Back
Microeconomics Study Guide: Foundations, Demand & Supply, and Elasticity
Study Guide - Smart Notes
 Tailored notes based on your materials, expanded with key definitions, examples, and context.
Module 1: The Economic Problem
Definition of Economics
Economics is a social science that studies how individuals, businesses, governments, and societies make choices to cope with scarcity and the incentives that influence these choices. Scarcity arises because our wants are unlimited, but resources are limited. Thus, economics revolves around three key concepts: scarcity, choice, and incentives.
Scarcity: The inability to satisfy all wants due to limited resources.
Choice: Decisions must be made about which wants to satisfy.
Incentives: Rewards or penalties that influence choices.
Positive statements: Testable claims about what is.
Normative statements: Opinions about what ought to be.
Microeconomics: Focuses on individual markets, consumers, and firms.
Macroeconomics: Examines the economy as a whole.
The Economic Questions
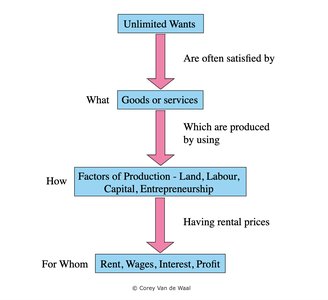
Economics addresses three fundamental questions: What to produce? How to produce? For whom to produce? Goods and services satisfy wants and are produced using factors of production: land, labour, capital, and entrepreneurship. Each factor earns a specific return: rent, wages, interest, and profit.
Land: Natural resources (earns rent).
Labour: Human effort (earns wages).
Capital: Machinery, tools, and human capital (earns interest).
Entrepreneurship: Organizes production (earns profit).
Economic Coordination
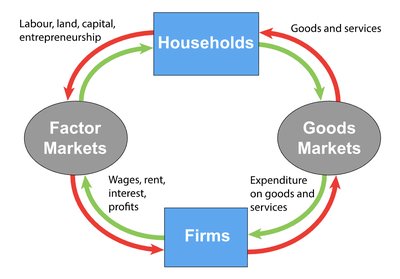
Economic coordination occurs through central planning or decentralized markets. Most economies are mixed, combining both systems. Firms hire factors of production to produce goods and services, while households provide resources and consume goods.
Firms: Hire factors and produce goods/services.
Markets: Enable buyers and sellers to exchange information and transact.
Households: Provide resources and consume goods/services.
Prices: Coordinate decisions between firms and households.
Production Possibility Frontier (PPF)
The PPF is a graphical representation showing all possible combinations of goods and services that can be produced with available resources and technology. It illustrates opportunity cost, marginal cost, and allocative efficiency.
Opportunity cost: Value of the next best alternative forgone.
Marginal cost: Opportunity cost of producing one more unit.
Marginal benefit: Benefit from consuming one more unit.
Allocative efficiency: Occurs where marginal benefit equals marginal cost.
PPF growth: Achieved through technological advancement or capital accumulation.
Specialization and Trade
Specialization allows individuals or nations to focus on activities where they have a comparative advantage, leading to greater efficiency and gains from trade.
Comparative advantage: Ability to produce at a lower opportunity cost.
Absolute advantage: Ability to produce more efficiently.
Module 2: Demand and Supply
Demand
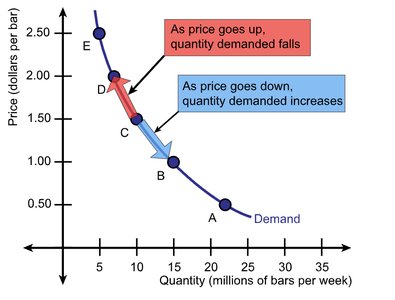
Demand refers to the relationship between the price of a good and the quantity consumers are willing and able to buy. The demand curve shows this relationship, typically downward sloping due to the law of demand.
Law of demand: As price increases, quantity demanded decreases; as price decreases, quantity demanded increases.
Substitution effect: Consumers switch to substitutes when price rises.
Income effect: Higher prices reduce purchasing power.
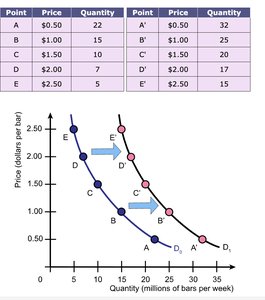
Demand schedule: Table showing quantities demanded at various prices.
Demand curve: Graphical representation of the demand schedule.
Shifts in Demand
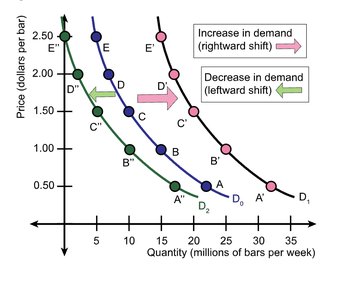
A change in demand occurs when factors other than price (such as income, preferences, population, or prices of related goods) change. This results in a shift of the demand curve.
Increase in demand: Demand curve shifts right.
Decrease in demand: Demand curve shifts left.
Normal goods: Demand increases as income increases.
Inferior goods: Demand decreases as income increases.
Substitutes: Demand increases if the price of a substitute rises.
Complements: Demand decreases if the price of a complement rises.
Supply
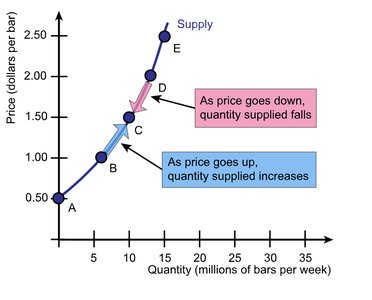
Supply refers to the relationship between the price of a good and the quantity producers are willing and able to sell. The supply curve is typically upward sloping due to the law of supply.
Law of supply: As price increases, quantity supplied increases; as price decreases, quantity supplied decreases.
Supply schedule: Table showing quantities supplied at various prices.
Supply curve: Graphical representation of the supply schedule.
Marginal cost: Opportunity cost of producing one more unit.
Shifts in Supply
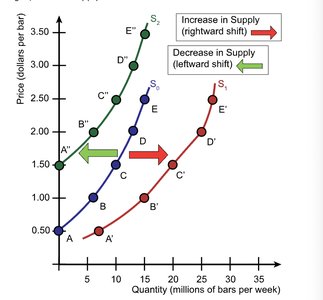
A change in supply occurs when factors other than price (such as technology, prices of factors of production, number of suppliers, or prices of related goods) change. This results in a shift of the supply curve.
Increase in supply: Supply curve shifts right.
Decrease in supply: Supply curve shifts left.
Market Equilibrium
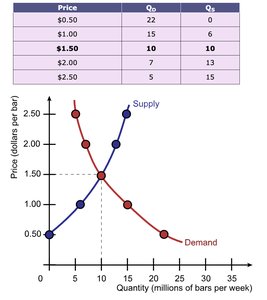
Market equilibrium occurs where the quantity demanded equals the quantity supplied. The equilibrium price is where the demand and supply curves intersect, and the equilibrium quantity is the amount bought and sold at this price.
Shortages: Occur when quantity demanded exceeds quantity supplied; prices rise.
Surpluses: Occur when quantity supplied exceeds quantity demanded; prices fall.
Invisible hand: Metaphor for the self-regulating nature of markets.
Solving for Equilibrium
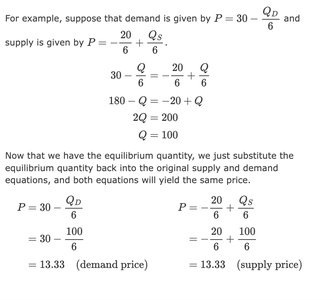
Equilibrium can be found algebraically by setting the demand and supply equations equal and solving for price and quantity.
Example equations:
Set and solve for :
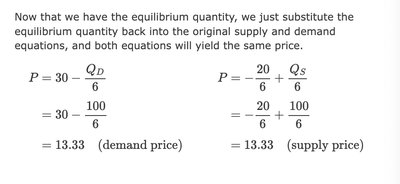
Substitute back to find :
Module 3: Elasticity
Price Elasticity of Demand
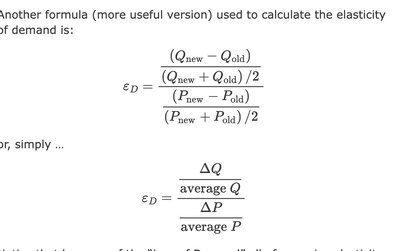
Elasticity measures the responsiveness of quantity demanded to changes in price. It is a unit-free measure, allowing comparison across goods and markets.
Formula:

Midpoint formula:
Types of Elasticity
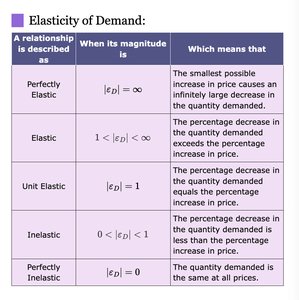
Elasticity can be classified based on its magnitude:
Perfectly inelastic: (quantity does not change with price).
Inelastic: (quantity changes less than price).
Unit elastic: (quantity changes equal to price).
Elastic: (quantity changes more than price).
Perfectly elastic: (quantity changes infinitely with price).
Factors Affecting Elasticity of Demand
Closeness of substitutes: More substitutes, more elastic demand.
Proportion of income spent: Higher proportion, more elastic demand.
Time elapsed: More time, more elastic demand.
Total Revenue and Elasticity
Total revenue is price multiplied by quantity sold. The effect of price changes on total revenue depends on elasticity:
Elastic demand: Price cut increases total revenue.
Inelastic demand: Price cut decreases total revenue.
Unit elastic: Price cut leaves total revenue unchanged.
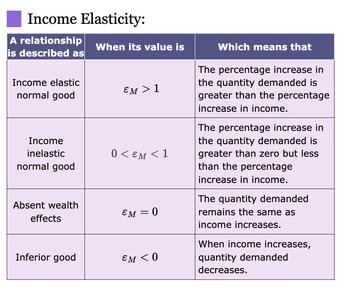
Income Elasticity of Demand
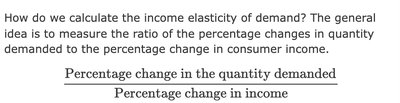
Income elasticity measures the responsiveness of quantity demanded to changes in income.
Formula:
Cross Elasticity of Demand
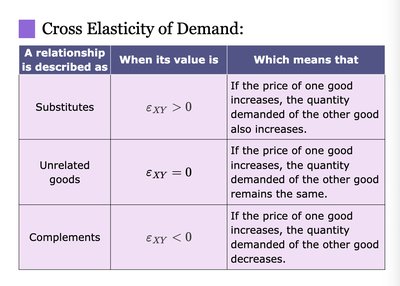
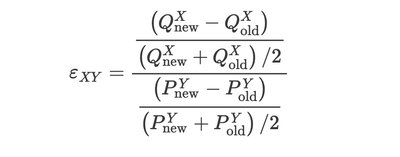
Cross elasticity measures the responsiveness of quantity demanded for one good to changes in the price of another good.
Formula:

Elasticity of Supply
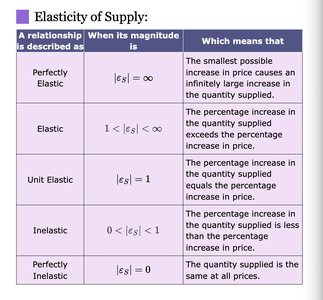
Elasticity of supply measures the responsiveness of quantity supplied to changes in price.
Formula:
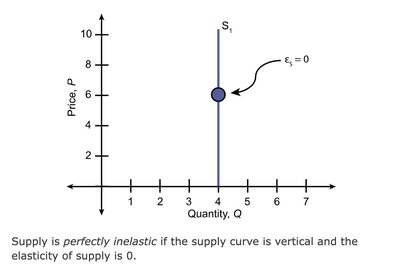
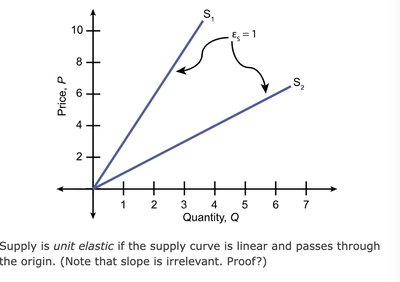
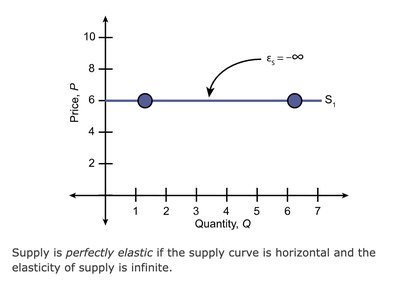
Types of Elasticity of Supply
Perfectly inelastic: (vertical supply curve).
Unit elastic: (linear supply curve through origin).
Perfectly elastic: (horizontal supply curve).
Module 4: Efficiency and Equity
Resource Allocation Methods
Scarce resources can be allocated by various methods, including market price, command, majority rule, contest, first-come first-served, lottery, personal characteristics, and force. Each method has its own advantages and is suitable for different situations.
Market price: Allocates resources to those willing to pay.
Command: Allocates by authority.
Majority rule: Allocates by vote.
Contest: Allocates to winners.
First-come, first-served: Allocates to those first in line.
Lottery: Allocates by chance.
Personal characteristics: Allocates to those with specific traits.
Force: Allocates by coercion or legal framework.
Consumer Surplus
Consumer surplus is the excess benefit received from a good or service over the amount paid. It is measured as the area under the demand curve and above the price paid.
Market demand curve: Horizontal sum of individual demand curves.
Marginal social benefit (MSB): Same as market demand curve.
Consumer surplus: Area under demand curve, above price.
Producer Surplus
Producer surplus is the excess received by producers over their marginal cost. It is measured as the area above the supply curve and below the market price.
Market supply curve: Horizontal sum of individual supply curves.
Marginal social cost (MSC): Same as market supply curve.
Producer surplus: Area above supply curve, below price.
Competitive Equilibrium and Efficiency
Competitive market equilibrium occurs where quantity demanded equals quantity supplied, achieving allocative efficiency. At this point, marginal social benefit equals marginal social cost.
Allocative efficiency: Achieved at equilibrium in competitive markets.
