 Back
BackMicroeconomics Study Guide: Foundations, Supply & Demand, and Elasticity
Study Guide - Smart Notes
 Tailored notes based on your materials, expanded with key definitions, examples, and context.
Economics: Foundations and Models
Scarcity, Trade-offs, and Opportunity Cost
Economics is the study of how people make choices to achieve their goals given limited resources. Scarcity means unlimited wants exceed available resources, forcing individuals and societies to make trade-offs. The true cost of any decision is its opportunity cost, which is what must be given up to obtain something else.
Scarcity: Unlimited wants vs. limited resources.
Trade-off: Producing more of one good means producing less of another.
Opportunity Cost: Value of the next best alternative forgone.
Example: Choosing to spend more on heart disease research means less funding for other diseases.
Production Possibilities Frontier (PPF)
The PPF illustrates the combinations of two goods that can be produced with fixed resources and technology. It demonstrates trade-offs and opportunity costs.
Centrally Planned Economy: Government allocates resources.
Market Economy: Households and firms allocate resources via markets.
Mixed Economy: Combination of market and government allocation.
Efficiency: Market economies tend to achieve productive and allocative efficiency, but not necessarily equity.
Marginal Analysis
Optimal decisions are made by comparing marginal benefits and marginal costs. Economists assume people are rational, respond to incentives, and make decisions at the margin.
Marginal: Extra or additional benefit/cost.
Positive Analysis: Describes what is.
Normative Analysis: Describes what ought to be.
Where Prices Come From: The Interaction of Demand and Supply
Market Demand and Supply
Market demand and supply curves show the relationship between price and quantity demanded or supplied. The law of demand states that as price falls, quantity demanded rises, and vice versa. The law of supply states that as price rises, quantity supplied rises.
Demand Curve: Downward sloping; shows quantity demanded at each price.
Supply Curve: Upward sloping; shows quantity supplied at each price.
Market Equilibrium: Where quantity demanded equals quantity supplied (Q*, P*).
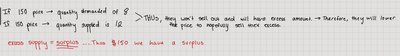
Shortage: Quantity demanded > quantity supplied.
Surplus: Quantity supplied > quantity demanded.
Variables that Shift Demand
Prices of Related Goods: Substitutes and complements.
Income: Normal goods (demand increases with income), inferior goods (demand decreases with income).
Tastes: Changes in consumer preferences.
Population and Demographics: More buyers increase demand.
Natural Disasters/Pandemics: Change preferences and demand.
Expected Future Prices: Anticipated price changes affect current demand.
Variables that Shift Supply
Prices of Inputs: Higher input prices decrease supply.
Technological Change: Positive changes increase supply; negative changes decrease supply.
Prices of Related Goods in Production: Substitutes and complements in production.
Number of Firms: More firms increase supply.
Expected Future Prices: Anticipated price changes affect current supply.
Natural Disasters/Pandemics: Disrupt production and decrease supply.
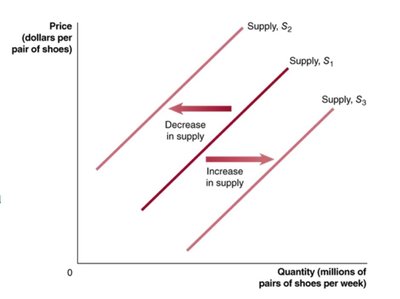
Supply Curve Shifts
Shifts in the supply curve occur when factors other than price change. An increase in supply shifts the curve to the right; a decrease shifts it to the left.
Change in Quantity Supplied: Movement along the curve due to price change.
Change in Supply: Shift of the entire curve due to other factors.
Market Equilibrium and Surplus/Shortage
Market equilibrium is achieved when quantity demanded equals quantity supplied. Surplus occurs when supply exceeds demand; shortage occurs when demand exceeds supply.
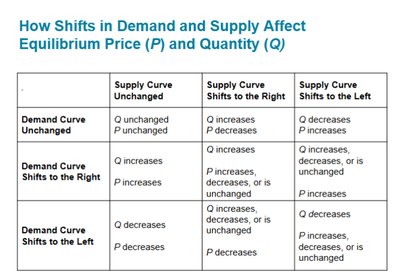
Effects of Shifts in Demand and Supply
Shifts in demand and supply curves affect equilibrium price and quantity. The direction and magnitude of these changes depend on which curve shifts and by how much.
Increase in Demand: Raises equilibrium price and quantity.
Decrease in Demand: Lowers equilibrium price and quantity.
Increase in Supply: Lowers price, raises quantity.
Decrease in Supply: Raises price, lowers quantity.
Simultaneous Shifts: Effects depend on relative size of shifts.
Elasticity: The Responsiveness of Demand and Supply
Price Elasticity of Demand
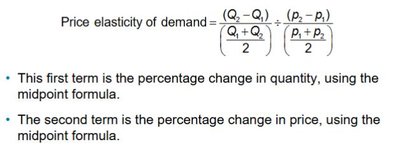
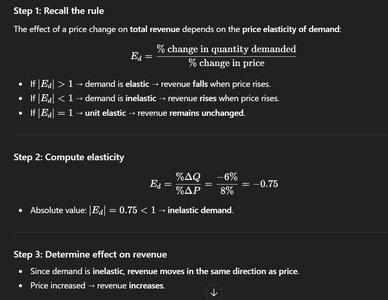
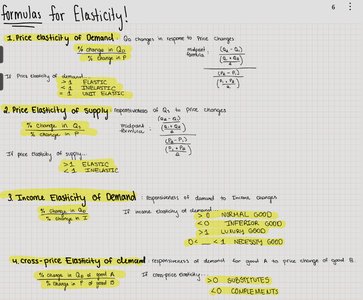
Elasticity measures how much quantity demanded or supplied responds to changes in price. The price elasticity of demand is calculated as the percentage change in quantity demanded divided by the percentage change in price.
Elastic Demand: ; quantity demanded changes more than price.
Inelastic Demand: ; quantity demanded changes less than price.
Unit Elastic: ; quantity and price change equally.
Perfectly Elastic: ; horizontal demand curve.
Perfectly Inelastic: ; vertical demand curve.
Midpoint Formula:
Percent change in quantity:
Percent change in price:
Price elasticity of demand:
Determinants of Price Elasticity of Demand
Availability of substitutes
Passage of time
Luxury vs. necessity
Definition of the market
Share of budget
Elasticity and Total Revenue
The effect of price changes on total revenue depends on elasticity:
If demand is elastic, price increase lowers revenue.
If demand is inelastic, price increase raises revenue.
If demand is unit elastic, revenue remains unchanged.
Price Elasticity of Supply
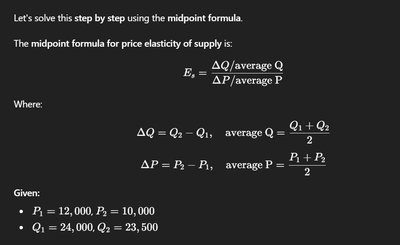
Price elasticity of supply measures how much quantity supplied responds to price changes. The midpoint formula is used for calculation:
Where , average
, average
Other Elasticity Measures
Income elasticity of demand and cross-price elasticity of demand measure responsiveness to income changes and price changes of related goods, respectively.
Income Elasticity:
Normal goods:
Inferior goods:
Luxury goods:
Necessities:
Cross-Price Elasticity:
Substitutes:
Complements:
Economic Efficiency, Surplus, and Government Price Setting
Economic Surplus and Efficiency
Economic surplus is the total benefit minus total cost from a decision. Efficiency is maximized when economic surplus is maximized, but this does not always mean the outcome is best for everyone (equity).
Consumer Surplus: Net benefit to consumers; area below demand curve and above price.
Producer Surplus: Net benefit to producers; area above supply curve and below price.
Marginal Benefit: Additional benefit from consuming one more unit.
Marginal Cost: Additional cost from producing one more unit.
Efficient Outcome: Maximizes sum of consumer and producer surplus.
Deadweight Loss: Surplus lost from not being at equilibrium.
Government Interventions: Price Ceilings and Floors
Government can set price ceilings (maximum price) and price floors (minimum price). These are binding if they affect the market equilibrium.
Price Ceiling: Binding if set below equilibrium price.
Price Floor: Binding if set above equilibrium price.
