 Back
BackMicroeconomics Study Guide: Indifference Curves, Budget Lines, and Consumer Choice
Study Guide - Smart Notes
 Tailored notes based on your materials, expanded with key definitions, examples, and context.
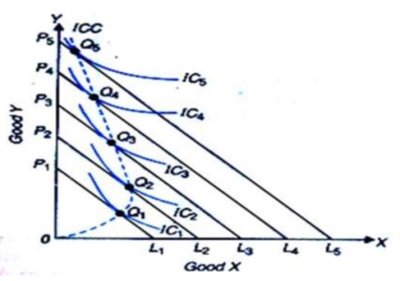
Q5. In the graph below, the solid lines are budget lines. The solid curves are indifference curves. The dashed curve is the income consumption curve. Which of the following statement is correct?
Background
Topic: Normal and Inferior Goods
This question tests your understanding of how changes in income affect the consumption of goods, as illustrated by the income consumption curve (ICC) and the relationship between budget lines and indifference curves.
Key Terms and Concepts:
Budget Line: Shows all combinations of two goods a consumer can afford given their income and prices.
Indifference Curve: Represents combinations of goods that provide the consumer with the same level of satisfaction.
Income Consumption Curve (ICC): Traces the consumer's optimal choices as income changes, holding prices constant.
Normal Good: A good for which demand increases as income increases.
Inferior Good: A good for which demand decreases as income increases.
Step-by-Step Guidance
Observe the direction in which the budget lines shift: As income increases, the budget lines move outward in a parallel fashion.
Identify the equilibrium points (where the budget line is tangent to the indifference curve) for each income level. These points trace out the ICC (dashed curve).
Examine the movement of the equilibrium points along the ICC: If the quantity of Good Y increases as income increases, Good Y is a normal good.
Compare the change in consumption of Good Y at different income levels to determine if the relationship is consistently positive or if it changes at different income levels.
Try solving on your own before revealing the answer!
Final Answer: Good Y is a normal Good (A)
As the budget lines shift outward, the equilibrium points show that the quantity of Good Y increases. This positive relationship between income and quantity demanded implies that Good Y is a normal good.
