Back
Microeconomics Study Guide: Scatterplots and Correlation
Study Guide - Smart Notes
 Tailored notes based on your materials, expanded with key definitions, examples, and context.
Q1. If the correlation between two variables is close to 0, what would a scatterplot show?
Background
Topic: Correlation and Scatterplots
This question tests your understanding of how the correlation coefficient () relates to the visual pattern in a scatterplot. Correlation measures the strength and direction of a linear relationship between two quantitative variables.
Key Terms and Formulas:
Correlation coefficient (): A value between -1 and 1 that indicates the strength and direction of a linear relationship.
Scatterplot: A graph showing the relationship between two quantitative variables.
Step-by-Step Guidance
Recall that measures linear association. If is close to 0, it means there is little to no linear relationship between the variables.
Think about what a scatterplot would look like if there is no linear relationship: the points would not form a clear straight-line pattern.
Consider whether the points might show any pattern at all, or if they would just be scattered randomly.
Reflect on whether a non-linear pattern could still exist even if is close to 0.
Try solving on your own before revealing the answer!
Final Answer: b. a cloud of points with no visible pattern.
If the correlation is close to 0, the scatterplot will show a cloud of points with no visible straight-line pattern. This means there is no linear relationship between the variables, though other types of relationships may still exist.
Q2. Researchers found a correlation of between soda consumed (in ounces) and aggression rating. If soda was measured in litres instead of ounces, what would the correlation be?
Background
Topic: Properties of Correlation
This question tests your understanding of how changing units of measurement affects the correlation coefficient. Correlation is a unitless measure, so it is not affected by linear transformations of the variables.
Key Terms and Formulas:
Correlation coefficient (): Measures linear association, unaffected by changes in units or linear scaling.
Linear transformation: Changing units (e.g., ounces to litres) is a linear transformation.
Step-by-Step Guidance
Recall that correlation is calculated using standardized values (z-scores), which removes the effect of units.
Think about what happens when you convert ounces to litres: you multiply the values by a constant (1 litre = 35 ounces).
Consider whether multiplying all values of one variable by a constant changes the correlation coefficient.
Review the properties of correlation: it is unaffected by changes in scale or units.
Try solving on your own before revealing the answer!
Final Answer: b. 0.3
The correlation coefficient remains the same when units are changed by multiplying by a constant. Correlation is unitless and unaffected by linear transformations.
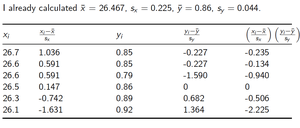
Q3. Find the correlation step by step for the sea surface temperature and coral growth data. Explain how your value for matches the direction of the linear pattern in your graph.
Background
Topic: Calculating Pearson Correlation
This question tests your ability to calculate the Pearson correlation coefficient () using data, and to interpret its sign and magnitude in relation to the scatterplot pattern.
Key Terms and Formulas:
Pearson correlation coefficient ():
: individual data values
: means of and
: standard deviations of and
Step-by-Step Guidance
List the data for sea surface temperature () and coral growth ().
Calculate the mean (, ) and standard deviation (, ) for each variable.
For each data point, compute and .
Multiply these standardized values for each pair and sum the results.
Divide the sum by to get .
Interpret the sign of in relation to the direction of the pattern in the scatterplot.

Try solving on your own before revealing the answer!
Final Answer:
The negative value of indicates a strong negative linear relationship, which matches the downward trend seen in the scatterplot.