 Back
BackChap 13 - Monopolistic Competition: Structure, Profit Maximization, and Long-Run Outcomes
Study Guide - Smart Notes
 Tailored notes based on your materials, expanded with key definitions, examples, and context.
Monopolistic Competition
Market Structures Overview
Market structures describe the competitive environment in which firms operate. The three primary structures are perfect competition, monopolistic competition, and monopoly. Each structure is defined by the number of firms, type of product, ease of entry, and examples of industries.
Perfect Competition: Many firms, identical products, high ease of entry (e.g., wheat farming).
Monopolistic Competition: Many firms, differentiated products, high ease of entry (e.g., restaurants, clothing stores).
Monopoly: One firm, unique product, entry blocked (e.g., tap water supply).
Definition and Key Characteristics
Monopolistic competition is a market structure characterized by:
Low barriers to entry and exit.
Many firms competing by selling differentiated, but highly substitutable, products.
Product differentiation allows firms to have some control over price, but the presence of close substitutes makes demand more elastic than in monopoly, but less elastic than in perfect competition.
Demand and Marginal Revenue in Monopolistic Competition
Product Differentiation and Demand Elasticity
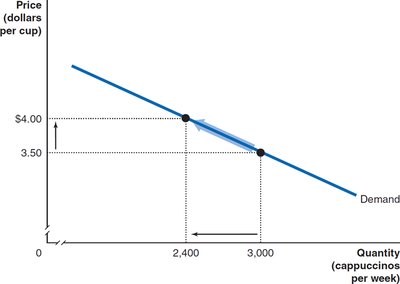
Firms in monopolistic competition differentiate their products through quality, branding, or other features. This differentiation makes the demand curve for each firm downward sloping, but more elastic than a monopolist's demand curve due to the availability of close substitutes.
Example: Artisanal coffee shops like Blue Bottle Coffee attract customers who perceive their product as unique, allowing them to charge higher prices than generic coffee providers.

Demand and Marginal Revenue Curves
The demand curve for a monopolistically competitive firm slopes downward, indicating that the firm must lower its price to sell additional units. The marginal revenue (MR) curve lies below the demand curve because each additional unit sold lowers the price on all units sold.
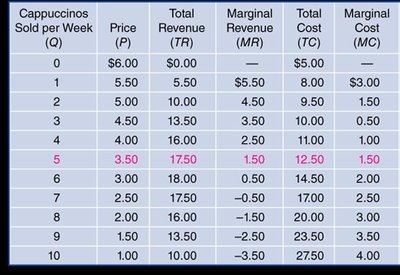
Tabular Analysis of Revenue and Cost
The following table illustrates the relationship between quantity sold, price, total revenue, marginal revenue, total cost, and marginal cost for a monopolistically competitive firm:
Cappuccinos Sold per Week (Q) | Price (P) | Total Revenue (TR) | Marginal Revenue (MR) | Total Cost (TC) | Marginal Cost (MC) |
|---|---|---|---|---|---|
0 | $6.00 | $0.00 | — | $5.00 | — |
1 | 5.50 | 5.50 | 5.50 | 8.00 | 3.00 |
2 | 5.00 | 10.00 | 4.50 | 9.50 | 1.50 |
3 | 4.50 | 13.50 | 3.50 | 10.00 | 0.50 |
4 | 4.00 | 16.00 | 2.50 | 11.00 | 1.00 |
5 | 3.50 | 17.50 | 1.50 | 12.50 | 1.50 |
6 | 3.00 | 18.00 | 0.50 | 14.50 | 2.00 |
7 | 2.50 | 17.50 | -0.50 | 17.00 | 2.50 |
8 | 2.00 | 16.00 | -1.50 | 20.00 | 3.00 |
9 | 1.50 | 13.50 | -2.50 | 23.50 | 3.50 |
10 | 1.00 | 10.00 | -3.50 | 27.50 | 4.00 |
Profit Maximization in the Short Run
Profit-Maximizing Rule
To maximize profit, a monopolistically competitive firm produces the quantity where marginal revenue equals marginal cost:
This rule applies to all firms that can adjust their output at the margin.
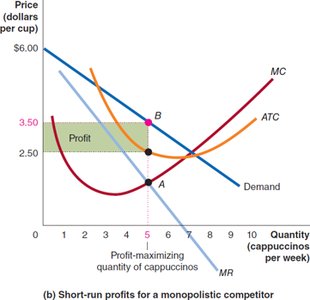
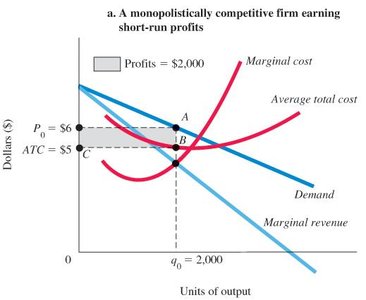
Identifying Profit or Loss
Find the quantity where .
Draw a vertical line at this quantity to the demand curve (to find price) and to the average total cost (ATC) curve (to find cost per unit).
The difference between price and ATC is profit (if positive) or loss (if negative) per unit.
Total profit or loss is the area of the rectangle with height and width .
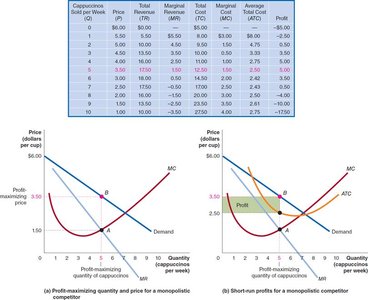
Short-Run Profit and Loss
If , the firm earns a profit.
If , the firm incurs a loss.
Long-Run Adjustments and Zero Economic Profit
Entry and Exit of Firms
Economic profit in the short run attracts new entrants, which increases competition and reduces the demand for each existing firm's product. Conversely, economic losses cause firms to exit, increasing demand for the remaining firms. In the long run, firms in monopolistic competition earn zero economic profit.
Entry shifts the demand curve for each firm to the left and makes it more elastic.
Exit shifts the demand curve for each firm to the right and makes it less elastic.
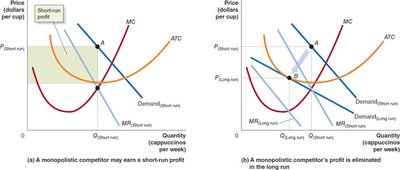
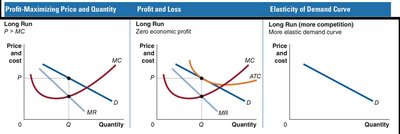
Long-Run Equilibrium
In the long run, the firm's demand curve is tangent to its ATC curve at the profit-maximizing quantity. There is no output level at which the firm can earn a profit; the best it can do is break even.
Comparing Monopolistic Competition and Perfect Competition
Key Differences
Monopolistic competitors produce differentiated products and face downward-sloping demand curves, while perfect competitors produce identical products and face perfectly elastic demand curves.
In the long run, both earn zero economic profit, but monopolistic competitors do not produce at minimum ATC and have excess capacity.
Summary Table: Market Structures
Characteristic | Perfect Competition | Monopolistic Competition | Monopoly |
|---|---|---|---|
Number of firms | Many | Many | One |
Type of product | Identical | Differentiated | Unique |
Ease of entry | High | High | Entry blocked |
Examples | Wheat, poultry | Restaurants, clothing stores | Tap water, mail delivery |
Additional info: In monopolistic competition, firms engage in non-price competition (e.g., advertising, product development) to maintain market power. In the long run, the inefficiency of excess capacity means that resources are not used as efficiently as in perfect competition.
