 Back
BackMonopoly, Cartels, and Price Discrimination – Study Notes
Study Guide - Smart Notes
 Tailored notes based on your materials, expanded with key definitions, examples, and context.
Monopoly, Cartels, and Price Discrimination
Introduction to Monopoly
A monopoly is a market structure where a single firm is the sole producer of a good or service with no close substitutes. This firm, called a monopolist, has significant market power, allowing it to influence the price of its product. Monopolies are rare because high profits attract entry by rival firms, but they can persist due to government protection or other barriers to entry (e.g., patents, government franchises).
10.1 A Single-Price Monopolist
Revenue Concepts for a Monopolist
Unlike a perfectly competitive firm, a monopolist faces the entire market demand curve, which is downward sloping. This means the monopolist must lower the price to sell additional units, creating a tradeoff between price and quantity sold.
Total Revenue (TR): The total amount received from sales, calculated as .
Average Revenue (AR): Total revenue divided by quantity, which equals the price: .
Marginal Revenue (MR): The additional revenue from selling one more unit: .
Because the monopolist must reduce price on all units to sell an extra unit, MR is less than price. The MR curve lies below the demand (AR) curve.
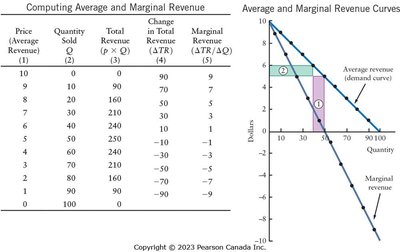
Relationship Between Demand Elasticity and Revenue
If demand is elastic (), total revenue increases as price decreases.
If demand is inelastic (), total revenue decreases as price decreases.
Total revenue is maximized where demand is unit-elastic ().
A profit-maximizing monopolist always produces on the elastic portion of its demand curve.
Short-Run Profit Maximization for a Monopolist
The monopolist follows two main rules for profit maximization:
Produce only if price (AR) exceeds average variable cost (AVC).
If producing, choose output where (marginal cost).
The profit-maximizing price is found on the demand curve at the chosen quantity. Since , always . If , the monopolist earns positive economic profit.
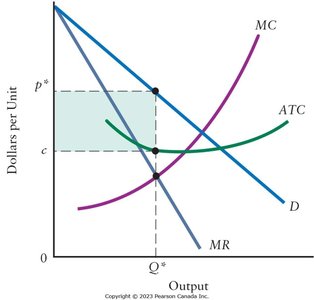
Monopoly vs. Perfect Competition
In perfect competition, and output is higher.
In monopoly, and output is lower than in competition.
Monopoly creates a deadweight loss—a loss of economic surplus due to restricted output and higher prices.
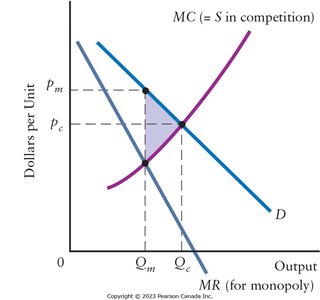
Entry Barriers
Monopolies persist only if entry by new firms is prevented. Entry barriers can be natural or created:
Natural Barriers:
Economies of scale (large firms have lower ATC).
Control of key resources (e.g., mines).
Network effects (value increases with more users, e.g., social media).
Created Barriers:
Patents and copyrights.
Government franchises (e.g., Canada Post).
Strategic firm behavior (e.g., heavy advertising, price wars).
The Very Long Run and Creative Destruction
Over time, technological innovation can erode monopoly power. Joseph Schumpeter described this process as creative destruction, where new products or processes replace old monopolies, driving economic growth and progress.
10.2 Cartels and Monopoly Power
Definition and Incentives
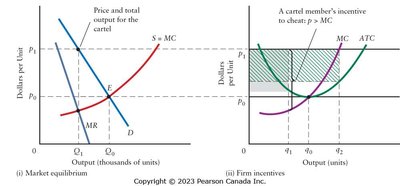
A cartel is a group of firms that collude to act as a single seller, restricting output and raising prices to maximize joint profits. Examples include OPEC and DeBeers. Cartels mimic monopoly behavior by reducing competition among members.
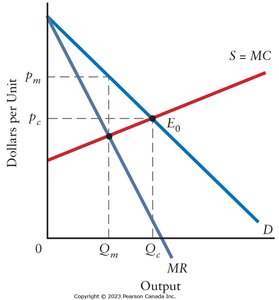
Problems That Cartels Face
Cartels are inherently unstable because each member has an incentive to cheat by selling more at the high cartel price.
If all cheat, output rises, price falls, and profits decrease for all.
To maintain profits, cartels often need to create entry barriers (e.g., licensing, quotas) to prevent new firms from entering.
10.3 Price Discrimination
Definition and Examples
Price discrimination occurs when a firm charges different prices for the same product to different consumers, not based on cost differences. Common examples include student or senior discounts, and different prices for business vs. residential electricity.
Legal as long as not based on race, gender, or religion.
Firms must prevent arbitrage (resale from low-price to high-price buyers).
Conditions for Price Discrimination
Market Power: The firm must be able to influence price.
Different Valuations: Consumers must have different willingness to pay.
Prevention of Arbitrage: The firm must prevent resale between consumer groups.
Forms of Price Discrimination
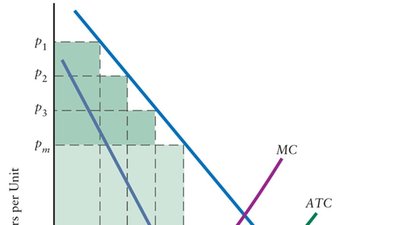
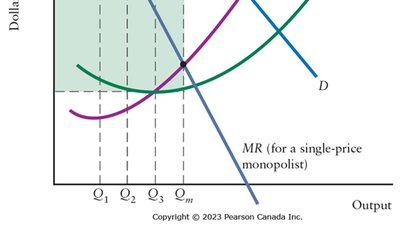
Among Units of Output: Charging different prices for different units purchased by the same consumer (e.g., quantity discounts, loyalty programs).
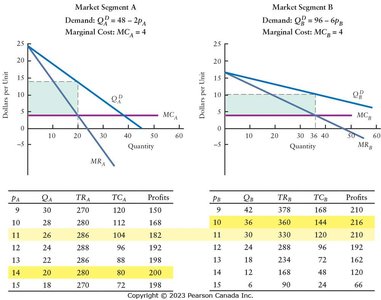
Among Market Segments: Charging different prices to different groups (e.g., age, location, time of purchase).
Hurdle Pricing: Consumers self-select into paying lower prices by overcoming a hurdle (e.g., using coupons).
Consequences of Price Discrimination
Price discrimination increases firm profits compared to single-price monopoly.
It can increase total output and economic efficiency if more units are sold at prices above marginal cost.
Some consumers benefit (those who buy at lower prices), while others may be worse off (those who pay higher prices).
No general rule about the effect on overall consumer welfare.
