 Back
BackChap 15: Monopoly: Market Structure, Revenue, and Profit Maximization
Study Guide - Smart Notes
 Tailored notes based on your materials, expanded with key definitions, examples, and context.
Monopoly
Market Structures Overview
Market structures describe the competitive environment in which firms operate. The three primary market structures are perfect competition, monopolistic competition, and monopoly. Each structure is defined by the number of firms, the type of product, and the ease of entry into the market.
Perfect Competition: Many firms, identical products, high ease of entry (e.g., wheat farming).
Monopolistic Competition: Many firms, differentiated products, high ease of entry (e.g., clothing stores).
Monopoly: One firm, unique product, entry blocked (e.g., tap water supply).
Characteristic | Perfect Competition | Monopolistic Competition | Monopoly |
|---|---|---|---|
Number of firms | Many | Many | One |
Type of product | Identical | Differentiated | Unique |
Ease of entry | High | High | Entry blocked |
Examples | Wheat, poultry | Clothing, restaurants | Mail delivery, tap water |
Definition and Characteristics of Monopoly
A monopoly is an industry with a single firm that produces a product for which there are no close substitutes, and significant barriers to entry prevent other firms from entering the industry. Monopolies represent the benchmark for minimum competition.
Single seller: The firm is the industry.
Unique product: No close substitutes exist.
Barriers to entry: High, preventing competition.
Market power: The monopolist can influence price.
Monopoly Power and Real-World Examples
Whether a firm is a monopoly depends on the availability of close substitutes. For example, a single pizzeria in a small town may not be a monopoly if consumers view other restaurants or grocery store pizzas as substitutes. However, if no close substitutes exist, the pizzeria may have monopoly power and can set higher prices.
Monopoly Demand Curve
The demand curve faced by a monopolist is the market demand curve, which is typically downward sloping. This means the monopolist must lower the price to sell additional units, unlike a perfectly competitive firm that is a price taker.
Monopoly Revenue Concepts
Average Revenue and Marginal Revenue
Average revenue (AR) is the revenue per unit sold, and marginal revenue (MR) is the change in total revenue from selling one more unit. For a monopolist, MR is always less than the price because lowering the price to sell more units reduces the revenue received on all previous units.
Average Revenue (AR):
Marginal Revenue (MR):
For a linear demand curve, the MR curve lies below the demand (AR) curve.
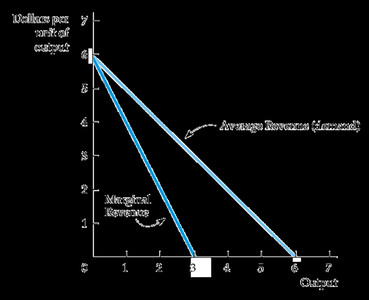
Price (P) | Quantity (Q) | Total Revenue (TR) | Marginal Revenue (MR) | Average Revenue (AR) |
|---|---|---|---|---|
$6 | 0 | $0 | — | — |
$5 | 1 | $5 | $5 | $5 |
$4 | 2 | $8 | $3 | $4 |
$3 | 3 | $9 | $1 | $3 |
$2 | 4 | $8 | -1 | $2 |
$1 | 5 | $5 | -3 | $1 |
Profit Maximization in Monopoly
Short-Run Profit Maximization
A monopolist maximizes profit by producing the quantity where marginal revenue equals marginal cost (). The corresponding price is found on the demand curve at this quantity. The monopolist can earn economic profit in the short run due to barriers to entry.
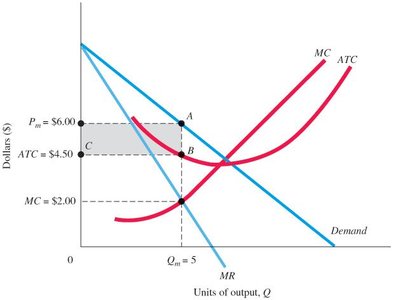
Profit-maximizing output: Where (e.g., units).
Profit-maximizing price: The price on the demand curve at (e.g., $P_m = $6.00).
Average total cost (ATC): The cost per unit at (e.g., $ATC = $4.50).
Profit:
Long-Run Monopoly and Barriers to Entry
In the long run, barriers to entry—such as control of key resources, government regulation, or economies of scale—allow the monopolist to maintain economic profits. The monopolist's demand curve remains the market demand curve, and profits can persist as long as barriers are effective.
Barriers to entry: Factors that prevent new firms from entering the market and competing away profits.
Examples: Patents, resource ownership, government franchises.
Additional info: In the absence of barriers, economic profits would attract entry, eroding monopoly power over time.
